Essay topics:
Bar Chart
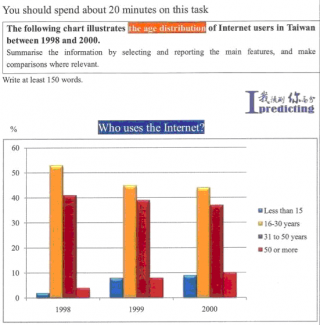
The bar chart shows the information about the Internet users in different age groups from 1998 to 2000 in Taiwan.
The Internet users who were between 16 years old to 30 years old had the highest percentage, which was showing a decrease from about 53% to about 44 % in 3 years. The group aged from 31 to 51, ranked second, saw a decline of 5% , from 53% in 2998 to 45% in 1999, and then made up for 37% in 2000.
The percentages in rest groups are similiar, and both of them climed in this selected period. The Internet users under 15 years old rose from 2% to 9 %, while those over 50...
Subscribe as testbig VIP readers and get unlimited access to essays on the top list.
Votes

Sentence: The percentages in rest groups are similiar, and both of them climed in this selected period.
Error: similiar Suggestion: similar
Attribute Value Ideal
Score: 7.5 out of 9
Category: Very Good Excellent
No. of Grammatical Errors: 0 2
No. of Spelling Errors: 1 2
No. of Sentences: 8 10
No. of Words: 160 200
No. of Characters: 643 1000
No. of Different Words: 93 100
Fourth Root of Number of Words: 3.557 4.0
Average Word Length: 4.019 4.6
Word Length SD: 2.164 2.4
No. of Words greater than 5 chars: 34 60
No. of Words greater than 6 chars: 22 50
No. of Words greater than 7 chars: 15 40
No. of Words greater than 8 chars: 5 20
Use of Passive Voice (%): 0 0
Avg. Sentence Length: 20 21.0
Sentence Length SD: 6.982 7.5
Use of Discourse Markers (%): 0.375 0.12
Sentence-Text Coherence: 0.436 0.35
Sentence-Para Coherence: 0.703 0.50
Sentence-Sentence Coherence: 0.072 0.07
Number of Paragraphs: 4 4