The bar chart below shows the number of students in three different courses from 2001 - 2004. Identify the main trends and summarize the data. (sample)
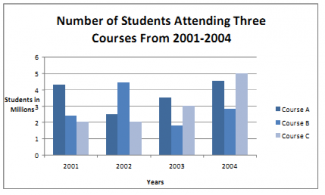
The bar chart featured in Task 1 shows students attending three different courses over a four year time from 2001 to 2004.
First of all, let's take a look at the data provided in the bar chart over the duration of the four year period. In 2001, 4.3 million students had presumably enrolled course A. In 2002, this figure had increased by nearly 20 percent to 2.5 million. The numbers continued to increase so that by 2003, 3.5 million people were at that time taking course A. Finally, in 2004 the number of student taking course A had increased by another whole million to 4.5 million students.
...
Subscribe as testbig VIP readers and get unlimited access to essays on the top list.

flaws:
No. of Words: 344 200
Number of Paragraphs: 6 4
Write the essay in 20 minutes.
Attribute Value Ideal
Score: 8.0 out of 9
Category: Excellent Excellent
No. of Grammatical Errors: 0 2
No. of Spelling Errors: 0 2
No. of Sentences: 16 10
No. of Words: 344 200
No. of Characters: 1548 1000
No. of Different Words: 136 100
Fourth Root of Number of Words: 4.307 4.0
Average Word Length: 4.5 4.6
Word Length SD: 2.286 2.4
No. of Words greater than 5 chars: 124 60
No. of Words greater than 6 chars: 83 50
No. of Words greater than 7 chars: 36 40
No. of Words greater than 8 chars: 17 20
Use of Passive Voice (%): 0 0
Avg. Sentence Length: 21.5 21.0
Sentence Length SD: 8.382 7.5
Use of Discourse Markers (%): 0.562 0.12
Sentence-Text Coherence: 0.443 0.35
Sentence-Para Coherence: 0.655 0.50
Sentence-Sentence Coherence: 0.163 0.07
Number of Paragraphs: 6 4