The chart below shows how people living in London travelled to work in the period 2000-2010 as a percentage of the total. Write a report for a university lecturer describing the information shown below. You should write at least 150 words.
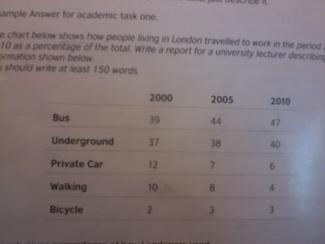
A glance at the provided graph reveals how Londoners used different means of transportation to commute to work between the years 2000 and 2010.
The most striking feature as can be seen from the data is the upward trend in the usage of bus, underground and bicycle, whereas the percentage of people travelling to work by car and on foot declined over the years.
Also noteworthy is the fact that the most dramatic decrease came in walking, which fell by sixty percent and the biggest increase was in bicycle, which rose by fifty percent.
It is apparent from the information supplied that bus was the main conveyance for work travelling in London. In 2000, this figure amounted to more than a third and rose significantly to nearly a half by the end of the first decade of this century.
In conclusion, there were substantial differences in how people in London used different forms os transports to travel to work from 2000 to 2010. While some experienced a period of growth, the rest were subject to go down.

Sentence: In conclusion, there were substantial differences in how people in London used different forms os transports to travel to work from 2000 to 2010.
Error: os Suggestion: No alternate word
Attribute Value Ideal
Score: 7.0 out of 9
Category: Good Excellent
No. of Grammatical Errors: 0 2
No. of Spelling Errors: 1 2
No. of Sentences: 7 10
No. of Words: 177 200
No. of Characters: 816 1000
No. of Different Words: 108 100
Fourth Root of Number of Words: 3.647 4.0
Average Word Length: 4.61 4.6
Word Length SD: 2.632 2.4
No. of Words greater than 5 chars: 51 60
No. of Words greater than 6 chars: 39 50
No. of Words greater than 7 chars: 26 40
No. of Words greater than 8 chars: 17 20
Use of Passive Voice (%): 0 0
Avg. Sentence Length: 25.286 21.0
Sentence Length SD: 7.796 7.5
Use of Discourse Markers (%): 0.714 0.12
Sentence-Text Coherence: 0.421 0.35
Sentence-Para Coherence: 0.832 0.50
Sentence-Sentence Coherence: 0.043 0.07
Number of Paragraphs: 5 4