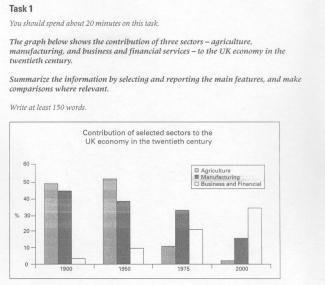
The graph below shows the contribution of three sectors - agriculture, manufacturing, and business and financial services - to the UK economy in the twentieth century.
The bar chart demonstrates the endowment of agriculture, manufacturing, business and financial sectors on British economy from twentieth to twenty first century.
To begin with, the first survey took place in 1900, according to which it can be noticed that agriculture was one of the significant contributions to the economy at approximately 5%. Manufacturing was considerably more important than business and financial sectors at about 45% while the remaining structure hit the second lowest point which refers to 4%.
In 1950 agriculture showed a slight increase to 53%. Afterwards it sharply decreased almost five fold. In the beginning of twenty first century the undisputed leader among represented sectors finally hit the lowest point to nearly 2%.
Generally, there was no wide disparity in contribution between agriculture and manufacturing. In the middle of twentieth century the amount of contribution of manufacturing was almost 40%. later, in 1975, the figure for this sector slightly decreased for 5% and overall, in 2000 it declined twice.
Compared with the first two sectors, the endowment of business and financial part, in contrast, showed a gradual upward trend during twentieth century. In 2000 it reached its peak of similar point as manufacturing sector in 1975.
In conclusion, with every quarter of the century the contribution of agriculture and manufacturing sectors demonstrated a downward trend while the importance of business and financial sectors to the UK economy was greater.

flaws:
No. of Words: 232 200 (write the essay in 20 minutes)
Sentence-Sentence Coherence: 0.028 0.07
Number of Paragraphs: 6 4
better to have 4 paragraphs:
para 1: introduction
para 2: body 1
para 3: body 2
para 4: conclusion
sample:
http://www.testbig.com/ielts-essays/qthe-graph-below-shows-different-mo…
http://www.testbig.com/ielts-essays/graph-below-gives-information-about…
http://www.testbig.com/ielts-essays/charts-below-show-uk-and-usa-energy…
http://www.testbig.com/ielts-essays/cheart-below-shows-information-abou…
or
para 1: introduction
para 2: conclusion
para 3: body 1
para 4: body 2
sample:
http://www.testbig.com/ielts-essays/climograph-below-shows-average-mont…
http://www.testbig.com/ielts-essays/graphs-below-show-types-music-album…
http://www.testbig.com/ielts-essays/table-below-gives-information-about…
Attribute Value Ideal
Score: 7.0 out of 9
Category: Good Excellent
No. of Grammatical Errors: 0 2
No. of Spelling Errors: 0 2
No. of Sentences: 11 10
No. of Words: 232 200
No. of Characters: 1241 1000
No. of Different Words: 123 100
Fourth Root of Number of Words: 3.903 4.0
Average Word Length: 5.349 4.6
Word Length SD: 3.16 2.4
No. of Words greater than 5 chars: 99 60
No. of Words greater than 6 chars: 78 50
No. of Words greater than 7 chars: 53 40
No. of Words greater than 8 chars: 43 20
Use of Passive Voice (%): 0 0
Avg. Sentence Length: 21.091 21.0
Sentence Length SD: 9.11 7.5
Use of Discourse Markers (%): 0.545 0.12
Sentence-Text Coherence: 0.393 0.35
Sentence-Para Coherence: 0.718 0.50
Sentence-Sentence Coherence: 0.028 0.07
Number of Paragraphs: 6 4