The graph below shows the proportion of the population aged 65 and over between 1940 and 2040 in three different countries. Summarise the information by selecting and reporting the main feature and make comparisons where relevant.
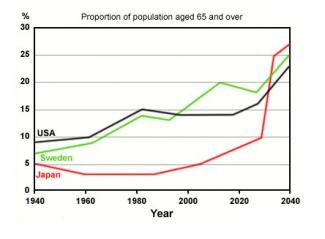
The graph illustrates how many people at the age of 65 and over lived in the USA, Japan and Sweden from 1940 to 2040. It can clearly be seen that, the proportion of aged people are expected to increase in all three countries.
First glance at the line graph reveals that, from 1940 in Sweden and the USA the number of old people went by 6% until 1980s. On the contrary, that indicator for Japan showed gradual downward trend (by 2%) bottoming out in 1985 getting to 3%. Then, the amount of the old maintained its level in all three countries until early 2000s.
When it comes to the predictions described by the chart, the figures indicate that, the percentage of the aged people in the USA and Sweden will rise gradually and will hit its peak in 2040, reaching to 23% and 25% accordingly. Whereas, the quantity of citizens who are 65 and older is expected to rise gradually until 2030 and take even steeper pace climbing to its top in 2040 (7%).
To conclude, the percentage of the elderly people are predicted to hold its middle position in Sweden, while Japan and the USA are anticipated to switch rankings in terms of the number of the aged population.

flaws:
Not cover all information from the graph. You have this issue on other essays too.
Attribute Value Ideal
Score: 7.0 out of 9
Category: Good Excellent
No. of Grammatical Errors: 0 2
No. of Spelling Errors: 0 2
No. of Sentences: 8 10
No. of Words: 210 200
No. of Characters: 915 1000
No. of Different Words: 113 100
Fourth Root of Number of Words: 3.807 4.0
Average Word Length: 4.357 4.6
Word Length SD: 2.369 2.4
No. of Words greater than 5 chars: 54 60
No. of Words greater than 6 chars: 38 50
No. of Words greater than 7 chars: 30 40
No. of Words greater than 8 chars: 17 20
Use of Passive Voice (%): 0 0
Avg. Sentence Length: 26.25 21.0
Sentence Length SD: 8.089 7.5
Use of Discourse Markers (%): 0.75 0.12
Sentence-Text Coherence: 0.437 0.35
Sentence-Para Coherence: 0.707 0.50
Sentence-Sentence Coherence: 0.038 0.07
Number of Paragraphs: 4 4