The graph below shows radio and television audiences throughout the day in 1992.
Write a report for a university lecturer describing the information shown below.
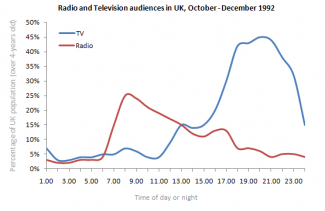
The line graph illustrates daily radio and television audience averages in the United Kingdom, from October to December 1992.
Radio and TV audiences, expressed in percentage of UK population over 4-years old, had quite different trends. Although very low values in both cases from 1 am to 6 am, radio was the first one from 6 am to 1 pm, with a sudden increase within the first two hours; this meant a rise from 3% to 25%, while TV remained stable with a small increase of roughly 1-2 points. After 8 am, radio trend decreased of 10 points throughout the following five hours, while TV trend rose...
Subscribe as testbig VIP readers and get unlimited access to essays on the top list.

Comments
It's a mistake, I should have
It's a mistake, I should have written "10 points percent", detailing more when the decrease happened.
I realize that the way I wrote it is not clear. Thanks for your advice, I won't make the same mistake a second time.
flaws:
what are those '10 points'?
Attribute Value Ideal
Score: 7.0 out of 9
Category: Good Excellent
No. of Grammatical Errors: 0 2
No. of Spelling Errors: 0 2
No. of Sentences: 8 10
No. of Words: 200 200
No. of Characters: 875 1000
No. of Different Words: 117 100
Fourth Root of Number of Words: 3.761 4.0
Average Word Length: 4.375 4.6
Word Length SD: 2.583 2.4
No. of Words greater than 5 chars: 56 60
No. of Words greater than 6 chars: 41 50
No. of Words greater than 7 chars: 33 40
No. of Words greater than 8 chars: 19 20
Use of Passive Voice (%): 0 0
Avg. Sentence Length: 25 21.0
Sentence Length SD: 11.045 7.5
Use of Discourse Markers (%): 0.625 0.12
Sentence-Text Coherence: 0.458 0.35
Sentence-Para Coherence: 0.73 0.50
Sentence-Sentence Coherence: 0.128 0.07
Number of Paragraphs: 4 4