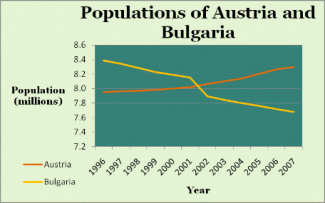
This graph shows the change in population in two countries from 1996 to 2007.

The line graph compares the number of people living in Bulgaria and Austria between 1996 and 2007.
It is clear that the population of Bulgaria saw a steady decrease over the 11-year period, while the figure for Austria grew steadily. The year 2002 marks the point at which the population of Austria overtook that of Bulgaria.
In 1996, there were about 8,4 million people in Bulgaria compared with just under 8 million in Austria. Over the next five years, the population of Bulgaria fell by just over 200,000 people before a sudden drop of around 300,000 people during the next year. By contrast, Austria's population had increased slightly by nearly 100,000 people by 2002.
In the year 2002 Bulgaria had the same population as Austria. The number of people living in Bulgaria reached a low of approximately 7,7 million people, burt it reached a high of around 8,3 million people in Austria by 2007.

flaws:
No. of Words: 154 200
Attribute Value Ideal
Score: 7.0 out of 9
Category: Good Excellent
No. of Grammatical Errors: 0 2
No. of Spelling Errors: 0 2
No. of Sentences: 8 10
No. of Words: 154 200
No. of Characters: 733 1000
No. of Different Words: 82 100
Fourth Root of Number of Words: 3.523 4.0
Average Word Length: 4.76 4.6
Word Length SD: 2.372 2.4
No. of Words greater than 5 chars: 60 60
No. of Words greater than 6 chars: 39 50
No. of Words greater than 7 chars: 22 40
No. of Words greater than 8 chars: 8 20
Use of Passive Voice (%): 0 0
Avg. Sentence Length: 19.25 21.0
Sentence Length SD: 6.057 7.5
Use of Discourse Markers (%): 0.125 0.12
Sentence-Text Coherence: 0.506 0.35
Sentence-Para Coherence: 0.73 0.50
Sentence-Sentence Coherence: 0.146 0.07
Number of Paragraphs: 4 5