The line graph below shows changes in the amount and type of fast food consumed by Australian teenagers from 1975 to 2000.
Summarize the information by selecting and reporting the main features and make comparisons where relevant.
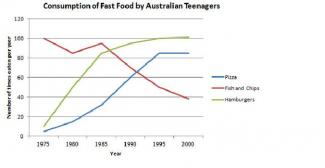
The picture shows canges in the number of fast food kinds consumed by austrailan mid-ages in the 25 years period between 1975 and 2000.
From the data, we can see that fish and chips significantly decreased in the amount of consumer as they dropped approximately by 60 points during the period. From 1975 to 1980 the fish and chips were slightly decreased by 20 points from 100 points at the start to 80 points in 1980 . Then, the number climbed a bit to approximately 90 points position in the 1985. Afterwards, the rate continually decreased by around 50 points to the 40 points position at the end of period.
In the contrast to the fish and chips, the rest of fast food types, pizza and hamburgers, had sharply increased during the 25 years period. Both of them started at approximately 10 points, then gradually increased to about 80 points for pizza and 100 points for hamburgers.
To conclude, the fish and chips were the only variation of fast food that decreased in the number of consumers. Otherwise, the hamburgers and the chips continually increased in the number between 1975 and 2000.

Sentence: The picture shows canges in the number of fast food kinds consumed by austrailan mid-ages in the 25 years period between 1975 and 2000.
Error: austrailan Suggestion: Australia
Error: canges Suggestion: No alternate word
Attribute Value Ideal
Score: 6.0 out of 9
Category: Satisfactory Excellent
No. of Grammatical Errors: 0 2
No. of Spelling Errors: 2 2
No. of Sentences: 9 10
No. of Words: 191 200
No. of Characters: 886 1000
No. of Different Words: 88 100
Fourth Root of Number of Words: 3.718 4.0
Average Word Length: 4.639 4.6
Word Length SD: 2.619 2.4
No. of Words greater than 5 chars: 60 60
No. of Words greater than 6 chars: 37 50
No. of Words greater than 7 chars: 30 40
No. of Words greater than 8 chars: 22 20
Use of Passive Voice (%): 0 0
Avg. Sentence Length: 21.222 21.0
Sentence Length SD: 4.315 7.5
Use of Discourse Markers (%): 0.222 0.12
Sentence-Text Coherence: 0.49 0.35
Sentence-Para Coherence: 0.718 0.50
Sentence-Sentence Coherence: 0.171 0.07
Number of Paragraphs: 4 4