The pie charts below show units of electricity production by fuel source in Australia and France in 1980 and 2000.
Summarise the information by selecting and reporting the main features, and make comparisons where relevant.
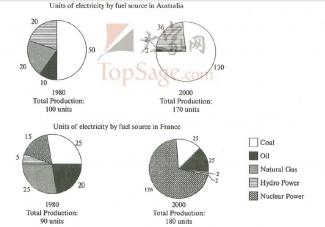
Given are the charts that illustrate how much electricity was produced in two countries by each fuel source in 1980 and 200.
To begin with, in Australia, the leading role in electricity production belonged to coal (50units) and the rest of electricity was generated using natural gas (20units), hydro power (20units), and oil (10units) in 1980. In 2000 coal preserved its place at top rising by 80 units, while the amount of hydro power in this process also increased reaching to 36 units and the usage of oil and natural gas respectively dropped by 18units and 8units.
When it comes to Fran...
Subscribe as testbig VIP readers and get unlimited access to essays on the top list.

Attribute Value Ideal
Score: 7.5 out of 9
Category: Very Good Excellent
No. of Grammatical Errors: 0 2
No. of Spelling Errors: 0 2
No. of Sentences: 6 10
No. of Words: 198 200
No. of Characters: 969 1000
No. of Different Words: 104 100
Fourth Root of Number of Words: 3.751 4.0
Average Word Length: 4.894 4.6
Word Length SD: 2.849 2.4
No. of Words greater than 5 chars: 59 60
No. of Words greater than 6 chars: 49 50
No. of Words greater than 7 chars: 30 40
No. of Words greater than 8 chars: 23 20
Use of Passive Voice (%): 0 0
Avg. Sentence Length: 33 21.0
Sentence Length SD: 9.22 7.5
Use of Discourse Markers (%): 0.5 0.12
Sentence-Text Coherence: 0.549 0.35
Sentence-Para Coherence: 0.863 0.50
Sentence-Sentence Coherence: 0.192 0.07
Number of Paragraphs: 4 4