The bar chart gives information concerning the postgraduate courses chosen at two British universities by gender in 2012. Summarise the information by selecting and reporting the main features and make comparisons where relevant.
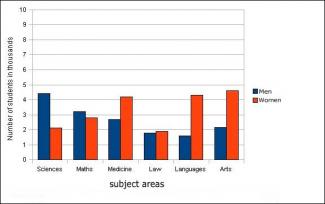
The bar chart shows data about how many men and women preferred different kinds of postgraduate courses in two UK universities in 2012.
Overall, it can be seen that subject areas such as sciences and math were popular among the men, whereas women commonly chose another subject fields like medicine, languages and arts. It should also be noted that, both gender interested in law equally.
Looking at the details, the number of men who preferred sciences was significantly higher, at 4500, than that of women at roughly 2000, in 2012. When it comes to math, the pattern was the same, b...
Subscribe as testbig VIP readers and get unlimited access to essays on the top list.

Attribute Value Ideal
Score: 7.5 out of 9
Category: Very Good Excellent
No. of Grammatical Errors: 0 2
No. of Spelling Errors: 0 2
No. of Sentences: 9 10
No. of Words: 214 200
No. of Characters: 982 1000
No. of Different Words: 119 100
Fourth Root of Number of Words: 3.825 4.0
Average Word Length: 4.589 4.6
Word Length SD: 2.411 2.4
No. of Words greater than 5 chars: 58 60
No. of Words greater than 6 chars: 47 50
No. of Words greater than 7 chars: 25 40
No. of Words greater than 8 chars: 15 20
Use of Passive Voice (%): 0 0
Avg. Sentence Length: 23.778 21.0
Sentence Length SD: 5.223 7.5
Use of Discourse Markers (%): 0.667 0.12
Sentence-Text Coherence: 0.467 0.35
Sentence-Para Coherence: 0.702 0.50
Sentence-Sentence Coherence: 0.104 0.07
Number of Paragraphs: 4 4