The bar chart shows components of GDP in the UK from 1992 to 2000.Summarize the information by selecting and reporting the main features and make comparisons where relevant.
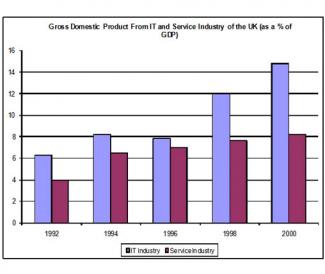
The bar chart illustrates the percentage of Gross Domestic Product from IT and Service industry in the UK,between 1992 and 2000.Overall,it could be seen that the GDP from It industry has increased over the 8 years period.
To begin,in 1992 compared to both industries 6% of GDP amount is more than the other industry which was from service industry,whereas the component 7% of GDP from service industry.The GDP accounted for 8% from It industry,while the service industry produced more than 6% of GDP in the UK.Although the percentage of GDP produced by service industry has climbed up much fewer than in 1994.It was almost 7%.But in the same year the GDP which is produced by It industry has declined at around 7.9%.
According to the bar graph,the percentage of GDP rose sharply at 12% from IT industry in 1998 as well as from service industry,7.8% of GDP produced in the UK.
To sum,over the 8 year period the highest percentage of 15%accounted for GDP from IT industry in 2000.The service industry produced at around 8% of GDP in 2000.Overall,from 1992 to 2000 GDP has produced from IT industry more than the service industry.

Comments
I want to get a band 6 score!
I want to get a band 6 score! If I write well organised answer will I get 6???
Yes, for sure. better to
Yes, for sure.
better to organize content like this:
para 1: introduction
para 2: body 1
para 3: body 2
para 4: conclusion
sample:
http://www.testbig.com/ielts-essays/graph-below-gives-information-about…
http://www.testbig.com/ielts-essays/you-should-spend-about-20-minutes-t…
or
para 1: introduction
para 2: conclusion
para 3: body 1
para 4: body 2
sample:
http://www.testbig.com/ielts-essays/climograph-below-shows-average-mont…
http://www.testbig.com/ielts-essays/graphs-below-show-types-music-album…
http://www.testbig.com/ielts-essays/table-below-gives-information-about…
Read essays by this user who is good at task I:
http://www.testbig.com/users/mrmo2610
The barchart illustrates the
The barchart illustrates the gross domestic product in IT and service industry in the united kingdom from 1992 and 2000. As is observed from the chart , the percentage of GDP from IT industry was higher than service industry.
In 2000,15% of gross domestic product from IT industry is the highest percentage than the previous years. only 8% of GDP from service industry in 2000.To beginning year of 1992, more than 6% of GDP from IT industry as well as 4% of GDP from service industry .After two years ,IT and service industry was slightly increased .In 1996, IT industry was declined from 9 % to 7%. but percentage of GDP from service industy increased sharply.
The gross domestic product from the IT industry rose suddenly to 12% and the percentage of GDP from service industry slowly increased in 1998.In comparison half of percentage is service industry at IT industry in 2000. It is noticed that rapid change in IT industry. however,service industry increases gradually from 1992 to 2000.
in 1992 compared to both industries 6% of GDP amount is more than the other industry which was from service industry
Description: can you re-write this sentence?
flaws:
The content is not well organized.
Always put a space after punctuation marks. Essay e-rater is sensitive.
Attribute Value Ideal
Score: 5.0 out of 9
Category: Satisfactory Excellent
No. of Grammatical Errors: 1 2
No. of Spelling Errors: 0 2
No. of Sentences: 4 10
No. of Words: 210 200
No. of Characters: 905 1000
No. of Different Words: 83 100
Fourth Root of Number of Words: 3.807 4.0
Average Word Length: 4.31 4.6
Word Length SD: 2.415 2.4
No. of Words greater than 5 chars: 58 60
No. of Words greater than 6 chars: 52 50
No. of Words greater than 7 chars: 36 40
No. of Words greater than 8 chars: 11 20
Use of Passive Voice (%): 0 0
Avg. Sentence Length: 52.5 21.0
Sentence Length SD: 23.5 7.5
Use of Discourse Markers (%): 0.5 0.12
Sentence-Text Coherence: 0.769 0.35
Sentence-Para Coherence: 1 0.50
Sentence-Sentence Coherence: 0.425 0.07
Number of Paragraphs: 4 4