The bar chart shows the scores of teams A, B and C over four different seasons.
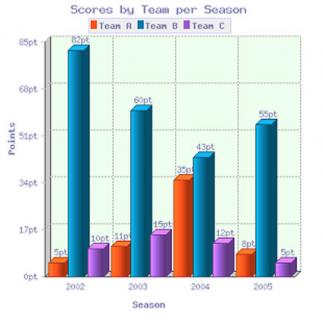
The bar chart shows the scores of three teams, A, B and C, in four consecutive seasons. It is evident from the chart that team B scored far higher than the other two teams over the seasons, though their score decreased as a whole over the period.
In 2002, the score of team B far exceeded that of the other two teams, standing at a massive 82 points compared to only 10 for team C and a very low 5 for team A. Over the next two years, the points for team B decreased quite considerably, dropping by around half to 43 by 2004. In contrast, team A’s points had increased by a massive 600% to reach...
Subscribe as testbig VIP readers and get unlimited access to essays on the top list.

Attribute Value Ideal
Score: 7.5 out of 9
Category: Very Good Excellent
No. of Grammatical Errors: 0 2
No. of Spelling Errors: 0 2
No. of Sentences: 5 10
No. of Words: 168 200
No. of Characters: 674 1000
No. of Different Words: 96 100
Fourth Root of Number of Words: 3.6 4.0
Average Word Length: 4.012 4.6
Word Length SD: 2.265 2.4
No. of Words greater than 5 chars: 35 60
No. of Words greater than 6 chars: 21 50
No. of Words greater than 7 chars: 15 40
No. of Words greater than 8 chars: 8 20
Use of Passive Voice (%): 0 0
Avg. Sentence Length: 33.6 21.0
Sentence Length SD: 12.971 7.5
Use of Discourse Markers (%): 0.4 0.12
Sentence-Text Coherence: 0.576 0.35
Sentence-Para Coherence: 0.733 0.50
Sentence-Sentence Coherence: 0.269 0.07
Number of Paragraphs: 2 4