The chart below shows the amount of money per week spent on fast foods in Britain.The graph shows trends in consumption of fast foods.Write a report for a university lecturer describing the information shown below.Summarize the information by selecting and reporting the main features and make comparisons where relevant.
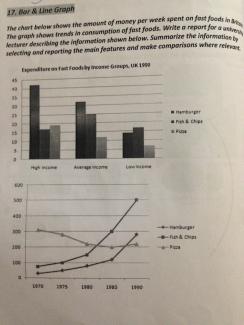
The bar chat illustrates the expenditure on fast food in Britain while the line graph highlights the trends in consumption of fast foods.
Overall,it is immediately apparent from the graphs that the highest amount was spent on hamburger by high income society whereas the fish and chips rose steadily.
To begin,there was a modest decline in the expenditure on hamburger following from high income(over 40) to as minimal as around 15 for low income group whereas,the line graph depicts the trend of hamburger which was least popular in 1970 and raised strongly up to 300. Moreover,fish and chips were popular in average income group shows a fairly similar pattern (over 15). The trend of fish and chips shows a gradual rise from 1970 to 1980. However,after 1980 it was rocketed and reached to the highest 500.
Moving further,pizza reflects a downfall relative to income groups. High income group spent highest around 20 and least by low income group(over 5). The bar chart also shows the downfall from 1970 to 1985 and slight rise from 1985 to 1990.

flaws:
Not so well organized. Better to put one graph or chart for one paragraph.
Attribute Value Ideal
Score: 6.5 out of 9
Category: Good Excellent
No. of Grammatical Errors: 0 2
No. of Spelling Errors: 0 2
No. of Sentences: 9 10
No. of Words: 183 200
No. of Characters: 850 1000
No. of Different Words: 101 100
Fourth Root of Number of Words: 3.678 4.0
Average Word Length: 4.645 4.6
Word Length SD: 2.319 2.4
No. of Words greater than 5 chars: 58 60
No. of Words greater than 6 chars: 41 50
No. of Words greater than 7 chars: 21 40
No. of Words greater than 8 chars: 12 20
Use of Passive Voice (%): 0 0
Avg. Sentence Length: 20.333 21.0
Sentence Length SD: 11.005 7.5
Use of Discourse Markers (%): 0.667 0.12
Sentence-Text Coherence: 0.42 0.35
Sentence-Para Coherence: 0.67 0.50
Sentence-Sentence Coherence: 0.103 0.07
Number of Paragraphs: 4 4