The charts below give information about USA marriage and divorce rates between 1970 and 2000, and the marital status of adult Americans in two of the years.
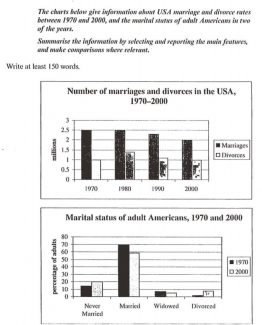
The bar chart show the amount of marriages and divorces between 1970 and 200 in the USA, and the rates of marital status among Americans in those two years.
It is shown that the number of Americans who were married was decreased during 1970 to 2000, but divorces rates remained constant. In, addition, the proportion of married couples in the USA dropped, while divorced partner arose.
In 1970, 2.5 million Americans got married. In the meantime, 1 million people in the USA suffered separation. Divorces rate reached the peak at 1.5 million divorces in 1980. By 2000, married population fell by a half million, and divorces rate also slipped down to 1 million.
Married was the highest marital status in the USA in 1970 with 70% of adult Americans were married. Divorced percentage was the lowest with about 1% of adult people in the USA. In 2000, married adults still placed on the top with 60%. While widowed became the lowest with only about 5% population of adult Americans.

Sentence: The bar chart show the amount of marriages and divorces between 1970 and 200 in the USA, and the rates of marital status among Americans in those two years.
Description: The fragment chart show the is rare
Suggestion: Possible agreement error: Replace show with verb, past tense
Attribute Value Ideal
Score: 7.0 out of 9
Category: Good Excellent
No. of Grammatical Errors: 1 2
No. of Spelling Errors: 0 2
No. of Sentences: 11 10
No. of Words: 169 200
No. of Characters: 785 1000
No. of Different Words: 92 100
Fourth Root of Number of Words: 3.606 4.0
Average Word Length: 4.645 4.6
Word Length SD: 2.354 2.4
No. of Words greater than 5 chars: 58 60
No. of Words greater than 6 chars: 46 50
No. of Words greater than 7 chars: 24 40
No. of Words greater than 8 chars: 12 20
Use of Passive Voice (%): 0 0
Avg. Sentence Length: 15.364 21.0
Sentence Length SD: 5.866 7.5
Use of Discourse Markers (%): 0.455 0.12
Sentence-Text Coherence: 0.435 0.35
Sentence-Para Coherence: 0.652 0.50
Sentence-Sentence Coherence: 0.106 0.07
Number of Paragraphs: 4 4