The charts below give information about USA marriage and divorce rates between 1970 and 2000, and the marital status of adult Americans in two of the years
The bar charts describe about the number of marriage and divorce from 1970 to 2000, and marital status of adult in the USA in these two years.
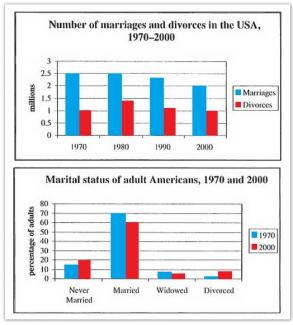
Overall, from the first bar chart, it can be seen that the rate of marriages in the USA saw an upward trend and the number of marriages was beyond the divorces rates over the prime time, while the number of divorces along the period fluctuated. Meanwhile, marital status of adult shows that the percentage of married was the highest in, both selected year, 1970 and 2000.
It is clear that the rates of marriages between 1970 and 1980 remained stable at 2.5 million citizens which were also higher than divorce status, whereas the same rate of divorces occurred in 1970 and 2000 which stood at only 1 million over the period.
From the second bar chart, the percentage of married status was much higher than other marital status, never married, widowed, and divorced, which reached to 70 % (1970) and 60% (2000). In the lowest percentage of marital status of adult in the USA was experienced by divorced status in 1970 with below 5%.

the percentage of married status was much higher than other marital status
the percentage of married status was much higher than the percentage of other marital status
In the lowest percentage of marital status of adult in the USA was experienced by divorced status
Description: what is the subject for this sentence? can you re-write this sentence?
Attribute Value Ideal
Score: 7.0 out of 9
Category: Good Excellent
No. of Grammatical Errors: 2 2
No. of Spelling Errors: 0 2
No. of Sentences: 6 10
No. of Words: 190 200
No. of Characters: 858 1000
No. of Different Words: 95 100
Fourth Root of Number of Words: 3.713 4.0
Average Word Length: 4.516 4.6
Word Length SD: 2.132 2.4
No. of Words greater than 5 chars: 57 60
No. of Words greater than 6 chars: 37 50
No. of Words greater than 7 chars: 20 40
No. of Words greater than 8 chars: 9 20
Use of Passive Voice (%): 0 0
Avg. Sentence Length: 31.667 21.0
Sentence Length SD: 9.894 7.5
Use of Discourse Markers (%): 0.5 0.12
Sentence-Text Coherence: 0.567 0.35
Sentence-Para Coherence: 0.751 0.50
Sentence-Sentence Coherence: 0.18 0.07
Number of Paragraphs: 3 4