The charts below show the levels of participation in education and science in developing countries and industrialized countries in 1980 and 1990.
Write a report for a university lecturer describing the information shown below.
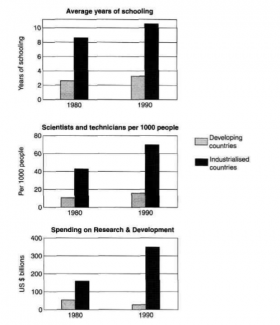
The charts compare education and science involvement of two different types of countries in 1980 and 1990.
From charts, we can see that there is an upward trend in each three categories overall and industrialised countries have the highest recordings except for research and development in developing countries.
Having a analyse by level of participation in education and science, average year of schooling and scientists and technicians per 1000 people have an upward trend while spending on Research and Development have opposites trends for the second type of country. There is a growth in schooling everywhere with a year. Industrialised population spends more than three times on school than the developing ones. There is a considerable increase of scientists and technicians overall. In 1980, the number of specialists from industrialised countries was three times more than from developing countries and after ten years, it doubled. The money spend on research and development by developing countries in 1990 was twice more than in 1990, while it decreased in the same way for the developing countries.
In conclusion, education and science sector in industrialised countries is much more developed than in developing country.

Having a analyse by level
Having an analysis by level
The money spend on research and development by developing countries in 1990 was twice more than in 1990
The money spending on research and development by developing countries in 1990 was twice more than in 1990
Attribute Value Ideal
Score: 6.5 out of 9
Category: Good Excellent
No. of Grammatical Errors: 2 2
No. of Spelling Errors: 0 2
No. of Sentences: 9 10
No. of Words: 191 200
No. of Characters: 1027 1000
No. of Different Words: 97 100
Fourth Root of Number of Words: 3.718 4.0
Average Word Length: 5.377 4.6
Word Length SD: 3.138 2.4
No. of Words greater than 5 chars: 74 60
No. of Words greater than 6 chars: 60 50
No. of Words greater than 7 chars: 48 40
No. of Words greater than 8 chars: 43 20
Use of Passive Voice (%): 0 0
Avg. Sentence Length: 21.222 21.0
Sentence Length SD: 10.031 7.5
Use of Discourse Markers (%): 0.444 0.12
Sentence-Text Coherence: 0.448 0.35
Sentence-Para Coherence: 0.646 0.50
Sentence-Sentence Coherence: 0.126 0.07
Number of Paragraphs: 4 4