The charts below show the results of a survey of adult education. The first chart shows the reasons why adults decide to study. The pie chart shows how people think the costs of adult education should be shared. Write a report for a university lecturer describing the information below.
Write at least 150 words, and spend 20 minutes.
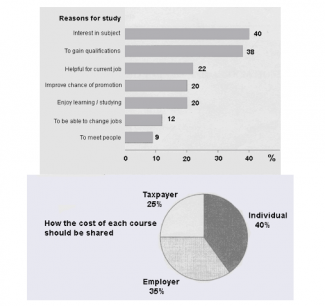
The bar chart presents information on six main reasons for adults to study and the pie chart provides data of people’s opinion on the education cost sharing. Both of the charts show the data in percentage.
A closer look at the bar chart provides the fact that the interest in subject appears to be the most common reason for study, which constitutes 40%. Slightly under that reason, with only 2% gap, gaining qualification comes second on the list. Interestingly, with only about half of these two top reasons’ percentage, helpful for current job, improve chance of promotion, and enjoy studying account for 22%, 20%, and 20% respectively. However, only small percentage of adults think that study will enable them to change jobs (12%) and to meet people (9%).
Generally speaking, the pie chart informs us how the cost of education should be divided into three different parties: individual, employer, and taxpayer. Individual appears to bear the highest percentage of the education fee, which is 40%. Following that, employer is considered to be responsible for 35% of the cost, while taxpayer is expected for the 25% left.

Attribute Value Ideal
Score: 7.0 out of 9
Category: Good Excellent
No. of Grammatical Errors: 1 2
No. of Spelling Errors: 0 2
No. of Sentences: 9 10
No. of Words: 186 200
No. of Characters: 898 1000
No. of Different Words: 113 100
Fourth Root of Number of Words: 3.693 4.0
Average Word Length: 4.828 4.6
Word Length SD: 2.652 2.4
No. of Words greater than 5 chars: 63 60
No. of Words greater than 6 chars: 50 50
No. of Words greater than 7 chars: 33 40
No. of Words greater than 8 chars: 20 20
Use of Passive Voice (%): 0 0
Avg. Sentence Length: 20.667 21.0
Sentence Length SD: 6.394 7.5
Use of Discourse Markers (%): 0.444 0.12
Sentence-Text Coherence: 0.393 0.35
Sentence-Para Coherence: 0.599 0.50
Sentence-Sentence Coherence: 0.095 0.07
Number of Paragraphs: 3 4