The graph below compares figures for the production and consumption of energy in the US from 1950 to 2000. It also predicts figures for 2025.
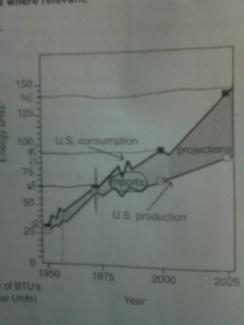
Given is the graph providing the amount of energy units that US consumed and produced from 1950 to 2000. In addition, it estimates that amount for 2025.
As can be seen, the consumption and production rate of energy units level up more rapidly in the first 25 years. The amount of energy units US used in 1975 doubled that figure in 1950. The number of energy units produced also grew sharply from approximately 30 to 60 units in 1975.
However, both the energy consumption and production rate increase more slowly in the 25 following years, particularly the production rate. While the number of en...
Subscribe as testbig VIP readers and get unlimited access to essays on the top list.

increase more slowly in the 25 following years
increase more slowly in the following 25 years
Attribute Value Ideal
Score: 7.5 out of 9
Category: Very Good Excellent
No. of Grammatical Errors: 0 2
No. of Spelling Errors: 0 2
No. of Sentences: 10 10
No. of Words: 215 200
No. of Characters: 981 1000
No. of Different Words: 94 100
Fourth Root of Number of Words: 3.829 4.0
Average Word Length: 4.563 4.6
Word Length SD: 2.632 2.4
No. of Words greater than 5 chars: 66 60
No. of Words greater than 6 chars: 41 50
No. of Words greater than 7 chars: 34 40
No. of Words greater than 8 chars: 22 20
Use of Passive Voice (%): 0 0
Avg. Sentence Length: 21.5 21.0
Sentence Length SD: 9.708 7.5
Use of Discourse Markers (%): 0.7 0.12
Sentence-Text Coherence: 0.506 0.35
Sentence-Para Coherence: 0.69 0.50
Sentence-Sentence Coherence: 0.279 0.07
Number of Paragraphs: 4 4