The graph below gives information about the number of cases of diarrhea in Mashhad
between 1983 and 1992.
Summarise the information by selecting and reporting the main features, and make
comparisons where relevant.
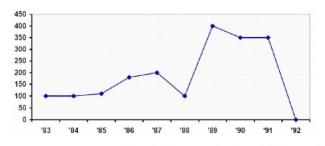
The given chart illustrates the number of people who suffer diarrhea in Mashhad from 1983 to 1992. Overall, we can see from the picture shown that the year with the highest cases is on 1989 while the lowest year is on 1992.
In the beginning, it reached 100 cases on 1983 and stood up at the same level until 1985. This constant position starts to change slightly on the following year. The figure increased to about 150 individuals on 1986. The numbers grew again on 1987 to 200 people with the disease.
Fortunately, the graph shows a 50% drop on the year 1988. However, it suddenly rose significantly as it increased 4 times the previous year, which makes the year 1989 the year with the highest number of cases. One year later, it decreases by 50 and stayed steady for a year. Finally, the numbers fall dramatically and tremendously hit a number of zero cases in 1992.

The line chart shown information about the figure of people who had a problem with diarrhea in the period of 10 years from 1983 in Mashhad.
It is clear that the number of cases of diarrhea had changed in this period shown. The figure of patients increased in the first 5 years and really reached top in 1889, but finished in 1992.
In 1983, the number of patients of this desease was 100 people and still stable in 1985. Then, in a short period of 2 years, this number increase to double in 1987 with about 200 cases. In the next year, the number of people had this disease went down to under 100 cases and it was the lowest number in the first 5 years of the servey.
It was only 1 year after, the figure of patents went up sudently to over 400 cases and peaked in 1989 and it really became the epidemic in this period. However, this number began decrease to about over 300 people in 1992 before came back to zero in 1992 and it was the year that human defeated this disease.