The graph below presents the car sales by village in 2013.
Summarise the information by selecting and report in the main features, and make comparisons where relevant.
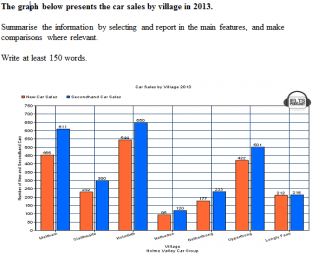
The graph illustrates the number of new and second hand car sales by Holme Valley Car Group in seven different villages in 2013.
In 2013, the amount of new car sales in Meltham stood at 455, and then increased to 611 for second hand cars. Similarly, in Helmfirth, 544 new cars were sold in comparison to used car, at 650, which was the highest car sales amongst other villages. In contrast, the number of both new and second hand car sales in Netherton was considerably lower than other villages, at 95 and 120 respectively. These trends of minimal sales were followed by Netherton where 177 new c...
Subscribe as testbig VIP readers and get unlimited access to essays on the top list.

Attribute Value Ideal
Score: 7.5 out of 9
Category: Very Good Excellent
No. of Grammatical Errors: 0 2
No. of Spelling Errors: 0 2
No. of Sentences: 9 10
No. of Words: 207 200
No. of Characters: 912 1000
No. of Different Words: 96 100
Fourth Root of Number of Words: 3.793 4.0
Average Word Length: 4.406 4.6
Word Length SD: 2.309 2.4
No. of Words greater than 5 chars: 51 60
No. of Words greater than 6 chars: 32 50
No. of Words greater than 7 chars: 24 40
No. of Words greater than 8 chars: 16 20
Use of Passive Voice (%): 0 0
Avg. Sentence Length: 23 21.0
Sentence Length SD: 3.712 7.5
Use of Discourse Markers (%): 0.778 0.12
Sentence-Text Coherence: 0.565 0.35
Sentence-Para Coherence: 0.721 0.50
Sentence-Sentence Coherence: 0.195 0.07
Number of Paragraphs: 4 4