The graph below shows the consumption of fish and some different kinds of meat in a European country between 1979 and 2004.
Summarise the information by selecting and reporting the main features, and make comparisons where relevant.
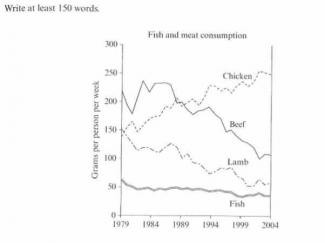
The graph illustrates the changes that have occurred in the consumption of fish and meat in a European country between 1979 and 2004. It can be noticed that the population has consumed chicken and beef in larger amounts, compared to the consumption of fish and lamb, that has slowly declined throughout the years.
As the graph shows, in 1984, beef was the most consumed type of meat in the country, being eaten more than 240 grams per person per week.
However, the consumption of beef has gradually declined, reaching its lowest point in 2004, with only 100 grams consumed per person per week. Similarly, the consumption of lamb, which reached its peak in 1979 with over 150 grams consumed, bottomed out in 2004, with people consuming only a third of the amount registered in 1979.
In sharp contrast to this, the preference for poultry has rapidly risen since 1979, reaching its highest point in 2004. It became then the most consumed type of meat in the country. Contrastively, fish has had the most steady development in consumption throughout the years. As a result,the amount of fish consumed in 1979 remained relatively the same during these periods of time.
In conclusion, the graph reveals how the consumers' preferences have change through the years and how has this affected the fish and meat consumption between specific intervals of time.

Attribute Value Ideal
Score: 6.5 out of 9
Category: Good Excellent
No. of Grammatical Errors: 0 2
No. of Spelling Errors: 0 2
No. of Sentences: 10 10
No. of Words: 228 200
No. of Characters: 1095 1000
No. of Different Words: 110 100
Fourth Root of Number of Words: 3.886 4.0
Average Word Length: 4.803 4.6
Word Length SD: 2.541 2.4
No. of Words greater than 5 chars: 70 60
No. of Words greater than 6 chars: 57 50
No. of Words greater than 7 chars: 40 40
No. of Words greater than 8 chars: 22 20
Use of Passive Voice (%): 0 0
Avg. Sentence Length: 22.8 21.0
Sentence Length SD: 6.539 7.5
Use of Discourse Markers (%): 0.5 0.12
Sentence-Text Coherence: 0.451 0.35
Sentence-Para Coherence: 0.723 0.50
Sentence-Sentence Coherence: 0.136 0.07
Number of Paragraphs: 5 4