The graph shows the proportion of energy that was produced from coal in four European countries from 1995 to 2010
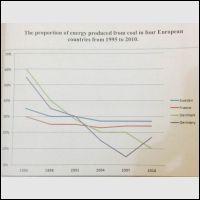
The line graph compares the production of energy from coal in Sweden, France, Denmark, and Germany between 1995 and 2010. Overall, the percentage of energy produced from coal declined in all four countries over the time frame.
There was a dramatic fall in the production in Denmark and Germany. Denmark’s production of energy from coal stood at 60% in 1995, higher than the other four countries. However, production levels dropped sharply over the next 15 years to finish at 10% in 2010, which was the lowest of that year. Energy production from coal in Germany followed a similar pattern, begin...
Subscribe as testbig VIP readers and get unlimited access to essays on the top list.

Attribute Value Ideal
Score: 7.5 out of 9
Category: Very Good Excellent
No. of Grammatical Errors: 0 2
No. of Spelling Errors: 0 2
No. of Sentences: 8 10
No. of Words: 188 200
No. of Characters: 896 1000
No. of Different Words: 94 100
Fourth Root of Number of Words: 3.703 4.0
Average Word Length: 4.766 4.6
Word Length SD: 2.547 2.4
No. of Words greater than 5 chars: 67 60
No. of Words greater than 6 chars: 45 50
No. of Words greater than 7 chars: 28 40
No. of Words greater than 8 chars: 18 20
Use of Passive Voice (%): 0 0
Avg. Sentence Length: 23.5 21.0
Sentence Length SD: 12.176 7.5
Use of Discourse Markers (%): 0.5 0.12
Sentence-Text Coherence: 0.493 0.35
Sentence-Para Coherence: 0.663 0.50
Sentence-Sentence Coherence: 0.107 0.07
Number of Paragraphs: 3 4