The graph shows the teleworking rates by sex in the United Kingdom between 1997 and 2005 and the rates by occupation and location of workplace in 2005.
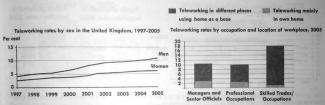

The graph illustrates the percentages of teleworkers in both sexes in the UK from 1997 to 2005, while the bar chart demonstrates the teleworking rates by professions and workplaces in 2005.
Looking at the graph, in 1997, a mere 3% of women and a tiny minority of men (4%) were doing teleworking and these figures rose steadily and had reached to 6% and 12% respectively, by 2005.
Moving to the bar chart, It can be clearly seen that managers and senior officials comprised 10% of teleworkers which 3% of them preferred to work in their own homes and the rest favored different places. It should be noted that there is a similar pattern for some who had professional occupations. Also many who had skilled trades constituted 18% of teleworkers which the overwhelming majority of them (17%) chose different places for working and only 1% of them worked in their personal homes.
In conclusion, in this period of time people's tendencies for teleworking were on the increase and in 2005 most teleworkers had skilled trades.

flaws:
are 'which' used properly in following sentences?
managers and senior officials comprised 10% of teleworkers which 3% of them preferred to work in their own homes
Also many who had skilled trades constituted 18% of teleworkers which the overwhelming majority of them (17%) chose different places for working
Attribute Value Ideal
Score: 6.5 out of 9
Category: Good Excellent
No. of Grammatical Errors: 0 2
No. of Spelling Errors: 0 2
No. of Sentences: 6 10
No. of Words: 174 200
No. of Characters: 821 1000
No. of Different Words: 105 100
Fourth Root of Number of Words: 3.632 4.0
Average Word Length: 4.718 4.6
Word Length SD: 2.929 2.4
No. of Words greater than 5 chars: 50 60
No. of Words greater than 6 chars: 41 50
No. of Words greater than 7 chars: 31 40
No. of Words greater than 8 chars: 24 20
Use of Passive Voice (%): 0 0
Avg. Sentence Length: 29 21.0
Sentence Length SD: 7.257 7.5
Use of Discourse Markers (%): 0.5 0.12
Sentence-Text Coherence: 0.475 0.35
Sentence-Para Coherence: 0.812 0.50
Sentence-Sentence Coherence: 0.152 0.07
Number of Paragraphs: 4 4