The graphs below show the numbers of male and female workers in 1975 and 1995 in several employment sectors of the republic of Freedonia.
Write a report for a university teacher describing the information shown.
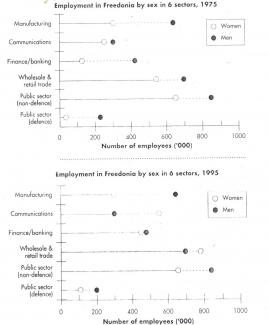
The graph compares and contrasts data on the changes in the number of men and women labours in six different work fields in terms of 21 years located in the Republic of Freedonia.
Generally speaking, the number of employees was unequally distributed between male and female, specifically with male workers dominating in four sectors.
Men in manufacturing sector averaged a considerably 350.000 higher people. The number remained constant in more than two decades. The same condition happened in Public Sector (non-defence) that steadily maintained more 200.000 male workers than women at the sa...
Subscribe as testbig VIP readers and get unlimited access to essays on the top list.

Attribute Value Ideal
Score: 7.0 out of 9
Category: Good Excellent
No. of Grammatical Errors: 0 2
No. of Spelling Errors: 0 2
No. of Sentences: 7 10
No. of Words: 162 200
No. of Characters: 856 1000
No. of Different Words: 105 100
Fourth Root of Number of Words: 3.568 4.0
Average Word Length: 5.284 4.6
Word Length SD: 2.745 2.4
No. of Words greater than 5 chars: 72 60
No. of Words greater than 6 chars: 53 50
No. of Words greater than 7 chars: 31 40
No. of Words greater than 8 chars: 21 20
Use of Passive Voice (%): 0 0
Avg. Sentence Length: 23.143 21.0
Sentence Length SD: 10.12 7.5
Use of Discourse Markers (%): 0.143 0.12
Sentence-Text Coherence: 0.45 0.35
Sentence-Para Coherence: 0.761 0.50
Sentence-Sentence Coherence: 0.085 0.07
Number of Paragraphs: 4 4