The line graph shows changes in the amount and type of fast food consumed by Australian teenagers from 1975 to 2000.
Summarize the information by selecting and reporting the main feature and make comparisons where relevant.
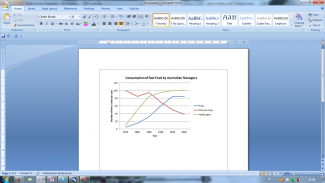
The line graph gives information about changes the amount and type of fast food consumed by young people in Australia from 1975 to 2000.
In 1975, the most popular of fast food was fish and chips in Australia. It was 100 times eaten by Australian. However, it felt back sharply in 1980 and went up steeply again in 1985 but it was less than 100 times. From then on wards declined dramatically 40 times in 2000.
On the contrary, consumption of pizza and hamburgers fast food categories were far lower than fish and chips by adolescent in Australia in 1975. Both pizza and hamburgers consumption had less than 20 times in this year and than the rate continuously rose sharply and reached about 85 times in 1985. However, In the next year, the rate increased steadily and level off from 1995 to 2000.
Overall, the consumption of fish and chips declined over the period, whereas the amount of pizza and hamburgers were eaten by youth increased in Australia.

wards declined dramatically 40 times in 2000.
wards declined dramatically to 40 times in 2000.
flaws:
pizza and hamburgers have different attributes.
Attribute Value Ideal
Score: 7.0 out of 9
Category: Good Excellent
No. of Grammatical Errors: 1 2
No. of Spelling Errors: 0 2
No. of Sentences: 9 10
No. of Words: 168 200
No. of Characters: 769 1000
No. of Different Words: 87 100
Fourth Root of Number of Words: 3.6 4.0
Average Word Length: 4.577 4.6
Word Length SD: 2.441 2.4
No. of Words greater than 5 chars: 37 60
No. of Words greater than 6 chars: 33 50
No. of Words greater than 7 chars: 23 40
No. of Words greater than 8 chars: 18 20
Use of Passive Voice (%): 0 0
Avg. Sentence Length: 18.667 21.0
Sentence Length SD: 6.766 7.5
Use of Discourse Markers (%): 0.556 0.12
Sentence-Text Coherence: 0.442 0.35
Sentence-Para Coherence: 0.668 0.50
Sentence-Sentence Coherence: 0.108 0.07
Number of Paragraphs: 4 4