the pie chart shows the amount of money that a children charity located in the USA spent and received in one year
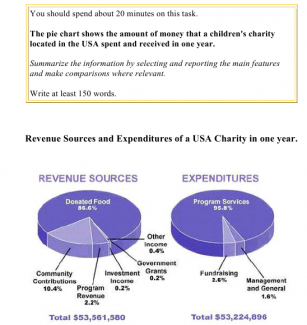
Both of the pie charts illustrate revenue sources and expenditures of children’s charity per one year in the USA. It can be seen that donated food makes a significant part of main incomes and program services is the main part of expenditures.
The total income of charity is about 53, 5 million dollar and fortunately expenditures are lower than incomes and this number is approximately 53, 2 million dollar so incomes can cover the expenditures easily. Community contributions makes a higher of the revenue after donated food, this indicator is one tenth of total. The other incomes which are named with program revenue, government grants, investment and other incomes are the remaining part of the first pie chart and accounting for only 3% combined.
Moving on expenditures chart, this chart is ramified three parts. 95, 8 percent of total belong so that fundraising, management and general are the last ones which are about four percent.

flaws:
No. of Words: 155 200
Attribute Value Ideal
Score: 7.0 out of 9
Category: Good Excellent
No. of Grammatical Errors: 0 2
No. of Spelling Errors: 0 2
No. of Sentences: 7 10
No. of Words: 155 200
No. of Characters: 769 1000
No. of Different Words: 88 100
Fourth Root of Number of Words: 3.528 4.0
Average Word Length: 4.961 4.6
Word Length SD: 2.833 2.4
No. of Words greater than 5 chars: 52 60
No. of Words greater than 6 chars: 42 50
No. of Words greater than 7 chars: 22 40
No. of Words greater than 8 chars: 19 20
Use of Passive Voice (%): 0 0
Avg. Sentence Length: 22.143 21.0
Sentence Length SD: 7.357 7.5
Use of Discourse Markers (%): 0.429 0.12
Sentence-Text Coherence: 0.444 0.35
Sentence-Para Coherence: 0.66 0.50
Sentence-Sentence Coherence: 0.058 0.07
Number of Paragraphs: 3 4