The pie charts below show units of electricity production by fuel source in Australia
and France in 1980 and 2000. (Part 1)
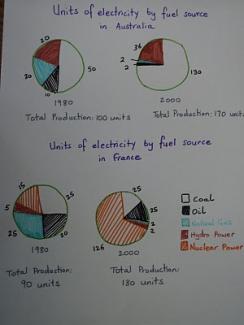
The pie charts compare the amount of electricity produced using five different sources of fuel in two countries over two separate years.
Total electricity production increased dramatically from 1980 to 2000 in both Australia and France. While the totals for both countries were similar, there were big differences in the fuel sources used.
Coal was used to produce 50 of the total 100 units of electricity in Australia in 1980, rising to 130 out of 170 units in 2000. By contrast, nuclear power became the most important fuel source in France in 2000, producing almost 75% of the country’s el...
Subscribe as testbig VIP readers and get unlimited access to essays on the top list.

Attribute Value Ideal
Score: 7.5 out of 9
Category: Very Good Excellent
No. of Grammatical Errors: 0 2
No. of Spelling Errors: 0 2
No. of Sentences: 8 10
No. of Words: 170 200
No. of Characters: 824 1000
No. of Different Words: 93 100
Fourth Root of Number of Words: 3.611 4.0
Average Word Length: 4.847 4.6
Word Length SD: 2.753 2.4
No. of Words greater than 5 chars: 54 60
No. of Words greater than 6 chars: 40 50
No. of Words greater than 7 chars: 33 40
No. of Words greater than 8 chars: 26 20
Use of Passive Voice (%): 0 0
Avg. Sentence Length: 21.25 21.0
Sentence Length SD: 6.28 7.5
Use of Discourse Markers (%): 0.375 0.12
Sentence-Text Coherence: 0.472 0.35
Sentence-Para Coherence: 0.72 0.50
Sentence-Sentence Coherence: 0.079 0.07
Number of Paragraphs: 4 4