The pie charts below show units of electricity production by fuel source in Australia
and France in 1980 and 2000. (Part 2)
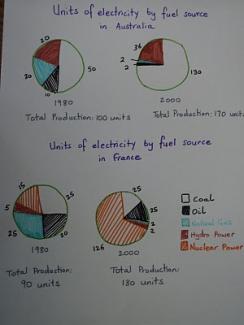
The pie charts show the amount of electricity that was produced from 5 different sources in Australia and France in 1980 and 2000, together with the total production of electricity in those years.
Overall, there are two key points to note. First, the total production of electricity in both Australia and France increased dramatically between 1980 and 2000, a rise of between 70% and 100% in a 20 year period. Secondly, the source of the electricity was very different in the two countries.
Looking at the charts in more detail, we can see that in Australia the amount of electricity produced from coal increased rapidly from 50 to 130 units, which was more than 75% of the total production of electricity in 2000. In France, on the other hand, the amount of electricity produced from coal did not increase and remained stable at only 25 units. This means that the percentage produced from coal declined significantly.
It is also noteworthy that in France the production of electricity from nuclear power grew enormously from 15 to 126 units, representing just under 75% of the total production in 2000, whereas in Australia no electricity was produced from nuclear.
To sum up,generating electricity from natural gas and hydro power had been declined,but the units created from the oil had been increased by 2000 in both countries.

Attribute Value Ideal
Score: 7.0 out of 9
Category: Good Excellent
No. of Grammatical Errors: 0 2
No. of Spelling Errors: 0 2
No. of Sentences: 9 10
No. of Words: 225 200
No. of Characters: 1083 1000
No. of Different Words: 110 100
Fourth Root of Number of Words: 3.873 4.0
Average Word Length: 4.813 4.6
Word Length SD: 2.791 2.4
No. of Words greater than 5 chars: 69 60
No. of Words greater than 6 chars: 55 50
No. of Words greater than 7 chars: 44 40
No. of Words greater than 8 chars: 33 20
Use of Passive Voice (%): 0 0
Avg. Sentence Length: 25 21.0
Sentence Length SD: 11.585 7.5
Use of Discourse Markers (%): 0.556 0.12
Sentence-Text Coherence: 0.476 0.35
Sentence-Para Coherence: 0.746 0.50
Sentence-Sentence Coherence: 0.146 0.07
Number of Paragraphs: 5 4