prices of house
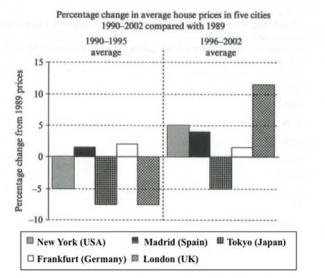
The bar chart provides information regarding the percentage increase or decrease of average prices of house five towns from 1990 to 2002 compared with 1989.
In general, most cities experienced increase in their average of house prices.
A more detailed look at the graph reveals that the most remarkable change was happened on that of the capital city of Japan, Tokyo. In 1989, it was below 5% but growth rapidly to around 12 percent in 1996-2002. This tremendous change was followed by the house price in New York (USA) which was -5% in the former year but suddenly stood at 5% in the later pointed years. Furthermore, both Madrid (Spain) and Tokyo (Japan) experienced the same rate of average house prices change (increased by around 2%). While the other 4 countries had higher price of house in 1996-2002, Frankfurt had lower house sale which was by around 1% (from 3% to 2%).

of average prices of house five towns
of average prices of house in five towns
most cities experienced increase
most cities experienced the increase
flaws:
No. of Grammatical Errors: 2 2
No. of Words: 152 200
Attribute Value Ideal
Score: 5.5 out of 9
Category: Satisfactory Excellent
No. of Grammatical Errors: 2 2
No. of Spelling Errors: 0 2
No. of Sentences: 7 10
No. of Words: 152 200
No. of Characters: 697 1000
No. of Different Words: 94 100
Fourth Root of Number of Words: 3.511 4.0
Average Word Length: 4.586 4.6
Word Length SD: 2.461 2.4
No. of Words greater than 5 chars: 45 60
No. of Words greater than 6 chars: 31 50
No. of Words greater than 7 chars: 22 40
No. of Words greater than 8 chars: 13 20
Use of Passive Voice (%): 0 0
Avg. Sentence Length: 21.714 21.0
Sentence Length SD: 5.921 7.5
Use of Discourse Markers (%): 1 0.12
Sentence-Text Coherence: 0.457 0.35
Sentence-Para Coherence: 0.646 0.50
Sentence-Sentence Coherence: 0.099 0.07
Number of Paragraphs: 3 4