The table below shows the proportion of different categories of families living in poverty in Australia in 1999.
Summarise the information by selecting and reporting the main features, and make comparisons where relevant.
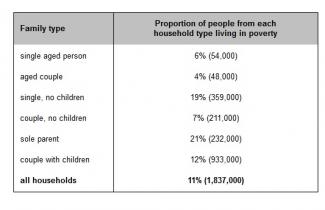
The table represents the data of percentage of six different categories of families living in poverty in Australia in the year 1999. The general overview here is that the single aged person, aged couple and couple with no children are below 10%, whereas, single with childless, couple with children are in between 10-20 % and sole parent living in poverty is highest with 21%.
Turning to the detail , on average, 11% of all households comprising nearly two million, were in this position. The categories of both families with sole parent and single parent with no children were higher than other groups with the percent of 21% and 19% respectively. This followed by households of couple having no children is less ,compared to couple with children having 12% of poverty.
In contrary, older people are less likely to be poor having aged people with 45 and single aged person with 6% of poverty.
Overall, it is clear that, households of single parent and those with children were more likely to be poor than other categories.

Attribute Value Ideal
Score: 7.0 out of 9
Category: Good Excellent
No. of Grammatical Errors: 0 2
No. of Spelling Errors: 0 2
No. of Sentences: 7 10
No. of Words: 173 200
No. of Characters: 823 1000
No. of Different Words: 85 100
Fourth Root of Number of Words: 3.627 4.0
Average Word Length: 4.757 4.6
Word Length SD: 2.406 2.4
No. of Words greater than 5 chars: 68 60
No. of Words greater than 6 chars: 39 50
No. of Words greater than 7 chars: 26 40
No. of Words greater than 8 chars: 13 20
Use of Passive Voice (%): 0 0
Avg. Sentence Length: 24.714 21.0
Sentence Length SD: 7.126 7.5
Use of Discourse Markers (%): 0.143 0.12
Sentence-Text Coherence: 0.476 0.35
Sentence-Para Coherence: 0.748 0.50
Sentence-Sentence Coherence: 0.094 0.07
Number of Paragraphs: 4 4