The three pie charts below show the changes in annual spending by a particular UK school in 1981, 1991 and 2001.
summarise the information by selecting and reporting the main features, and make comparison where relevant
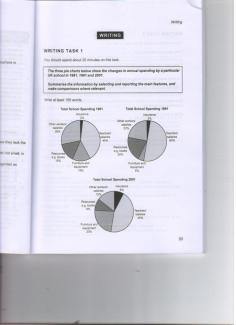
The percentage of money which a particular UK school spends on 5 different categories are shown by the below charts in 3 different years.
In 1981, the school spends around 70% of its budget for teachers' and other workers' salaries, contributing 40% and 28% respectively. The school spends same amount of money on resources and furniture and equipment (15%) in 1981. Insurance is a slight part of budget and only 2% of budget is spent on this category.
In 1991, there is a slight increase in percentage of money which is gone to salaries in comparison with 1981. The salaries percentage rises from 68% in 1981 to 72% in 1991. Although the resources percentage grows from 15% to 20% in 1991, the school spends less percentage on furniture and equipment, and it decreases from 15% to just 5% in 1991.
Although there is a great fall in salaries' percentage in 2001, teachers' salaries are triple of other workers' salaries in 2001. The school spends more on furniture and equipment in 2001 rather than spends on resources. In this year insurance's percentage goes up and reach 8%.
In the final analysis, other workers' salaries' percentage declines with the march of time, by contrast, insurance's percentage increases. In all years, most of the budget is assigned to salaries, while, less of it is divided to insurance.

The percentage of money which a particular UK school spends on 5 different categories are shown
The percentage ...is shown
The percentages ... are shown
Sentence: Although the resources percentage grows from 15 to 20 in 1991, the school spends less percentage on furniture and equipment, and it decreases from 15 to just 5 in 1991.
Description: A noun, plural, common is not usually followed by a noun, singular, common
Suggestion: Refer to resources and percentage
flaws:
No. of Words: 224 200
Write the essay in 20 minutes.
Some duplicated words or sentences.
Attribute Value Ideal
Score: 6.5 out of 9
Category: Good Excellent
No. of Grammatical Errors: 2 2
No. of Spelling Errors: 0 2
No. of Sentences: 12 10
No. of Words: 224 200
No. of Characters: 1049 1000
No. of Different Words: 98 100
Fourth Root of Number of Words: 3.869 4.0
Average Word Length: 4.683 4.6
Word Length SD: 2.765 2.4
No. of Words greater than 5 chars: 75 60
No. of Words greater than 6 chars: 53 50
No. of Words greater than 7 chars: 49 40
No. of Words greater than 8 chars: 31 20
Use of Passive Voice (%): 0 0
Avg. Sentence Length: 18.667 21.0
Sentence Length SD: 5.104 7.5
Use of Discourse Markers (%): 0.083 0.12
Sentence-Text Coherence: 0.413 0.35
Sentence-Para Coherence: 0.681 0.50
Sentence-Sentence Coherence: 0.128 0.07
Number of Paragraphs: 5 4