You should spend about 20 minutes on this task.
The chart shows British Emigration to selected destinations between 2004 and 2007.
Summarize the information by selecting and reporting the main features and make comparisons where relevant.
Write at least 150 words.
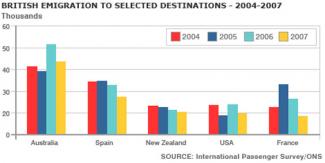
The bar chart provides information about the number of British people migrating to 5 different countries in 4 different years. Countries are Australia, Spain, New Zealand, USA and France.
In Australia, The trend is fluctuating year by year. The percentage of immigration is highest in 2006. For remaining 3 years the number approximately about 40.000. Unlike Australia the figure for Spain is downward. In the first 2 years it is almost stable. from 2005 the level of immigrants starts to decrease. and at the last year the number is roughly 25.000 which was 35.000 in 2004. in New Zealand, in 2004 the number of people migrating to this country is more than 20.000. Furthermore, the number of people preferring this country is decreasing very steadily. People who migrates to USA is fluctuating. In 2004, the number was about 24.000. In the next year, it felled bellow 20 thousands. The number in 2006 was exactly the same as 2004. In the following year the figure was 20.000. Finally, the difference in the number of people preferring France is noticeable. In 2004, it was more than 20.000. Moreover, it experienced dramatic increase in the next year. In the preceding years the number decreased considerably and in 2007 it was roughly 18.000.
In conclusion, the most preferred country is Australia. However, for New Zealand and USA the level of emigration is lowest.

People who migrates to USA is fluctuating
People who migrate to USA are fluctuating
is lowest.
is the lowest.
Attribute Value Ideal
Score: 6.5 out of 9
Category: Good Excellent
No. of Grammatical Errors: 2 2
No. of Spelling Errors: 0 2
No. of Sentences: 19 10
No. of Words: 229 200
No. of Characters: 1106 1000
No. of Different Words: 107 100
Fourth Root of Number of Words: 3.89 4.0
Average Word Length: 4.83 4.6
Word Length SD: 2.702 2.4
No. of Words greater than 5 chars: 87 60
No. of Words greater than 6 chars: 54 50
No. of Words greater than 7 chars: 41 40
No. of Words greater than 8 chars: 33 20
Use of Passive Voice (%): 0 0
Avg. Sentence Length: 12.053 21.0
Sentence Length SD: 9.473 7.5
Use of Discourse Markers (%): 0.316 0.12
Sentence-Text Coherence: 0.329 0.35
Sentence-Para Coherence: 0.435 0.50
Sentence-Sentence Coherence: 0.037 0.07
Number of Paragraphs: 3 4