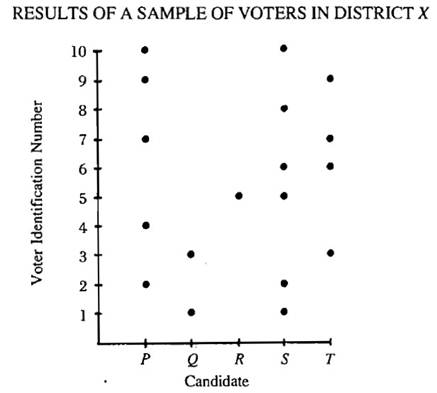
The graph above shows how a sample of l0 different voters (vertical axis) voted for 5 different candidates (horizontal axis) . Each voter voted for either one or two of the five candidates. (No voter voted twice for the same candidate. ) The two candidates receiving the most votes were the winners. The sample constituted 5 percent of those in the district who voted, and the number of votes in the district for each candidate was in the same proportion as the number of votes in the sample for each candidate.