The bar graph below shows the numbers of employed persons by job type and sex for Australia in the year 2003. Summarise the information by selecting and reporting the main features, and make comparisons where relevant.
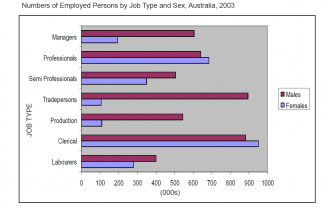
The bar chart gives information about Australian employment in several job positions for 2003 classified by gender.
According to the data given by the bar chart, it can be clearly seen that there are more males than females employed overall.
Having an analysis by the number of people, the highest population is recorded is the clerical sector with a clear difference between both sexes with 70 females working. The similar ratio is recorded between men and women who have professional jobs. Admittedly, the female workers are employed more than half of counterparts’ in Semi Professional and Labourer section. Obviously, the women managers are more than three times of their business partners. Finally, the last two jobs show the lowest female population, only 100 counted. Moreover, there are more trade persons employed than productive people.
To sum up, females still dominate the clerical and professional sector compared to other fields whose employers are mostly men.

the highest population is recorded is the clerical sector
the highest population which is recorded is the clerical sector
the highest population recorded is the clerical sector
flaws:
No. of Words: 154 200
Attribute Value Ideal
Score: 7.0 out of 9
Category: Good Excellent
No. of Grammatical Errors: 1 2
No. of Spelling Errors: 0 2
No. of Sentences: 9 10
No. of Words: 154 200
No. of Characters: 803 1000
No. of Different Words: 105 100
Fourth Root of Number of Words: 3.523 4.0
Average Word Length: 5.214 4.6
Word Length SD: 2.591 2.4
No. of Words greater than 5 chars: 60 60
No. of Words greater than 6 chars: 48 50
No. of Words greater than 7 chars: 32 40
No. of Words greater than 8 chars: 17 20
Use of Passive Voice (%): 0 0
Avg. Sentence Length: 17.111 21.0
Sentence Length SD: 5.405 7.5
Use of Discourse Markers (%): 0.333 0.12
Sentence-Text Coherence: 0.397 0.35
Sentence-Para Coherence: 0.642 0.50
Sentence-Sentence Coherence: 0.06 0.07
Number of Paragraphs: 4 4