The chart below shows the percentage change in the share of international students among university graduates in different Canadian provinces between 2001 and 2006.
Summarise the information by selecting and reporting the main features, and make comparisons where relevant.
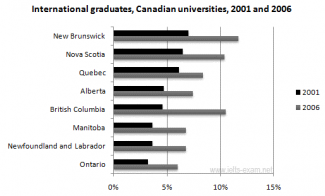
The bar chart compares proportions of oversea college graduates in various areas of Canada in 2001 and 2006.
It is manifest from the diagram that New Brunswick has the largest ratio of international students in both 2001 and 2006. There was only around 8% students who came from abroad in 2001 in Brunswick, yet this figure took a large leap and rose to about 12% in 2006. Interestingly, both Nova Scotia and British Columbia represented the second largest portion (roughly 11%) of oversea students, whereas Nova Scotia was almost 3% higher than British Columbia in 2001. In comparison, Ontario remained the least popular province for oversea students, which accounted for around 3% and 6% in 2001 and 2006 respectively.
To sum up, percentages of international graduates have increased in all provinces over the period. Most areas ranked the same in terms of ratios of oversea students, except British Columbia which jumped the most from 2001 to 2006 (approximately 7% increase).

flaws:
Sentence Length SD: 4.823 7.5
Attribute Value Ideal
Score: 6.5 out of 9
Category: Good Excellent
No. of Grammatical Errors: 0 2
No. of Spelling Errors: 0 2
No. of Sentences: 7 10
No. of Words: 160 200
No. of Characters: 795 1000
No. of Different Words: 98 100
Fourth Root of Number of Words: 3.557 4.0
Average Word Length: 4.969 4.6
Word Length SD: 2.751 2.4
No. of Words greater than 5 chars: 61 60
No. of Words greater than 6 chars: 46 50
No. of Words greater than 7 chars: 29 40
No. of Words greater than 8 chars: 16 20
Use of Passive Voice (%): 0 0
Avg. Sentence Length: 22.857 21.0
Sentence Length SD: 4.823 7.5
Use of Discourse Markers (%): 0.286 0.12
Sentence-Text Coherence: 0.486 0.35
Sentence-Para Coherence: 0.68 0.50
Sentence-Sentence Coherence: 0.091 0.07
Number of Paragraphs: 3 4