The charts below show the results of a survey of adult education. The first chart
shows the reasons why adults decide to study. The pie chart shows how people
think the costs of adult education should be shared.
Write a report for a university lecturer, describing the information shown below.
You should write at least 150 words.
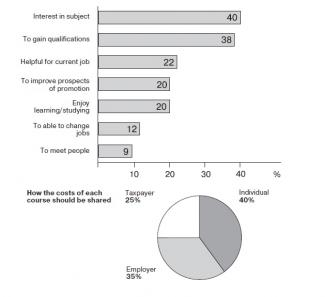
The chart shows reasons why adults study, meanwhile the pie chart tells about people think adults’ education should be shared.
Firstly, the percentage of the interest in subject by adults is maximum 40% while the percentage of the to meet people is the lowest position that has 9% for the reason adults. Furthermore, the gain qualification amount 38%; meanwhile, the percentage of the to able to change jobs 12% for adults. In the same way, the reasons of the helpful for current job having by adults 22%. In the sameness, the percentage of the improve prospects of promotion and the enjoying learning/studying own the same of the percentages (20 per cent).
According to the data, the pie chart tells about the costs of the percentages, starts 100%. The percentage of the individual is the highest rating 40% in the pie chart. The following by adults’ education is the employer having 35%. Moreover, the taxpayer is the lowest position which has 25%.
To summarize, there are many adults who study having excuses for their education.

Comments
The charts below show the
The charts below show the results of a survey of adult education. The first chart
shows the reasons why adults decide to study. The pie chart shows how people
think the costs of adult education should be shared.
Write a report for a university lecturer, describing the information shown below.
------------------------------------------
The illustrations provided represent the outcome of survey of adult education. The first chart explains the reason why people decides to study in adulthood while the pie chart shows how the price of adult education should be contributed.
There are some reasons why adult consider to study. Interest in subjects and to gain qualifications are the two most important reasons adults decide to go back to school. People think that the cost of adult study should be shared by individuals, employers and by taxpayers.
It is clear from the chart that 78% of adults think to study due to their interest in subject and gaining qualifications. The remaining 22% of adults consider going back to study because they believe further study would help them in current jobs, prospect of promotions, enjoy learning, changing of jobs and finally meeting people. It is interesting that 9% adult go to study simply because they want to meet people while 12% of adult want to change their current job and thus decide to study. In summary, the most common reason adults decide to study is interest in subject followed by to gain qualifications. Whereas the least reason is meeting people.
According to the pie chart the cost of study should be contributed by individual, employers and taxpayers. However, 40% people believe that the cost of mature education should be paid by individual himself while 35% suggest employers should pay for their employees undergoing study. Finally, only 25% people think taxpayers should pay for adult education.
Dear Sir, would you please
Dear Sir, would you please score my writing task1 submitted above? Thanks in advance.
Thank you Sir for your time.
Thank you Sir for your time. Have a nice weekend.
the pie chart tells about people think adults’ education should be shared.
Description: can you re-write this sentence?
Attribute Value Ideal
Score: 5.5 out of 9
Category: Satisfactory Excellent
No. of Grammatical Errors: 1 2
No. of Spelling Errors: 0 2
No. of Sentences: 10 10
No. of Words: 175 200
No. of Characters: 824 1000
No. of Different Words: 91 100
Fourth Root of Number of Words: 3.637 4.0
Average Word Length: 4.709 4.6
Word Length SD: 2.575 2.4
No. of Words greater than 5 chars: 62 60
No. of Words greater than 6 chars: 40 50
No. of Words greater than 7 chars: 30 40
No. of Words greater than 8 chars: 20 20
Use of Passive Voice (%): 0 0
Avg. Sentence Length: 17.5 21.0
Sentence Length SD: 6.515 7.5
Use of Discourse Markers (%): 0.4 0.12
Sentence-Text Coherence: 0.444 0.35
Sentence-Para Coherence: 0.665 0.50
Sentence-Sentence Coherence: 0.14 0.07
Number of Paragraphs: 4 4