The graph below descibes the statstics rainfall for somecountry
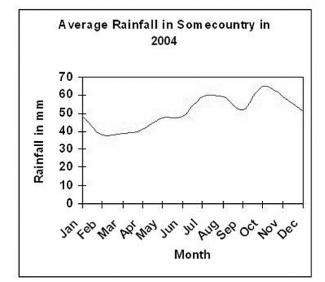
The line graph indicates the figure of rainfall for a country in 2004. Overall, the rate of rainfall grows as months goes by.
More specifically, the volume of rainfall was recorded at 50mm in January, followed by a sharp fall to the level of 40mm in Feburay. Subsequently, the number grew steadily over the next three months, before it saw an increase to just under 50mm in June and leveled out in July. From this point onward, the average rate of rainfall soared again during the months of August and September, at around 60mm, after which the rate dipped to 50mm again in October.There was a dramatic growth in the figure in November, reaching to the peak of approximately 65mm and then declining gradually to as the same level as in Januray by December.
In brief, it can clearly be seen that the volume of rainfall was relatively higher during the Autumn and Winter season.

Comments
thanks test-big team. ! first
thanks test-big team. ! first time i scored 7 in writting task1, which encouraged me a lot.
as months goes by.
as months go by.
as the month goes by.
flaws:
No. of Words: 156 200
Attribute Value Ideal
Score: 7.0 out of 9
Category: Good Excellent
No. of Grammatical Errors: 1 2
No. of Spelling Errors: 0 2
No. of Sentences: 6 10
No. of Words: 156 200
No. of Characters: 705 1000
No. of Different Words: 96 100
Fourth Root of Number of Words: 3.534 4.0
Average Word Length: 4.519 4.6
Word Length SD: 2.379 2.4
No. of Words greater than 5 chars: 51 60
No. of Words greater than 6 chars: 30 50
No. of Words greater than 7 chars: 21 40
No. of Words greater than 8 chars: 8 20
Use of Passive Voice (%): 0 0
Avg. Sentence Length: 26 21.0
Sentence Length SD: 17.078 7.5
Use of Discourse Markers (%): 0.333 0.12
Sentence-Text Coherence: 0.477 0.35
Sentence-Para Coherence: 0.717 0.50
Sentence-Sentence Coherence: 0.082 0.07
Number of Paragraphs: 3 4