The graph below shows the rate of women’s literacy and population growth in selected countries from 1998 to 2000.
Write a report for a university lecturer describing the information shown below.
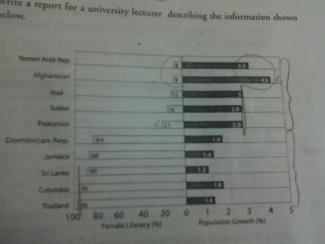
A glance at a graph provided reveals the negative correlation between the rate of population growth and the women’s literacy.
The graph shows that the largest proportion of female literate from 1998 to 2000 was to be found in Thailand, Columbia and Sri Lanka, and each of these countries also had by far the lowest population growth. Thailand and Columbia, with the greatest female literacy, namely 96 per cent, also experienced 1,4 and 1,8 per cent of population growth respectively. In terms of population growth, Afghanitan came to the first, and it also recorded the second lowest female lit...
Subscribe as testbig VIP readers and get unlimited access to essays on the top list.

Attribute Value Ideal
Score: 7.5 out of 9
Category: Very Good Excellent
No. of Grammatical Errors: 0 2
No. of Spelling Errors: 0 2
No. of Sentences: 7 10
No. of Words: 185 200
No. of Characters: 888 1000
No. of Different Words: 98 100
Fourth Root of Number of Words: 3.688 4.0
Average Word Length: 4.8 4.6
Word Length SD: 2.538 2.4
No. of Words greater than 5 chars: 64 60
No. of Words greater than 6 chars: 43 50
No. of Words greater than 7 chars: 34 40
No. of Words greater than 8 chars: 17 20
Use of Passive Voice (%): 0 0
Avg. Sentence Length: 26.429 21.0
Sentence Length SD: 7.997 7.5
Use of Discourse Markers (%): 0.429 0.12
Sentence-Text Coherence: 0.545 0.35
Sentence-Para Coherence: 0.804 0.50
Sentence-Sentence Coherence: 0.205 0.07
Number of Paragraphs: 4 4