The pie charts below show electricity generation by source in New Zealand and Germany in 1980 and 2010.
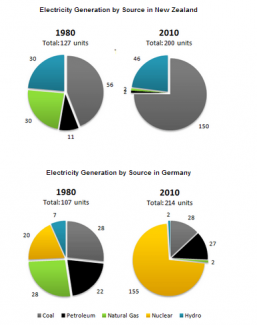
The presented charts illustrate the changes in the generation of electricity by five main sources, namely coal, peyroleum, natural gas, nuclear and hydro over a period of three decades in Germany and New Zealand.
The source of coal, in 1980, in New Zealand, constituded its overwhelming majority with 56 , while petroleum accounted for 11, whereas natural gas and hydro energy manifested themselves at the same amount of overall units with 30. Interestingly enough, after 30 years, petroleum and natural gas decreased to the same size of 200 units with just 2, where was a rise of roughly 100 units at coal.
As to Germany, all energy sources demonstrated themselves almost with the same numbers by hovering around 24 units except hydro energy which occupied 7 of 107 units in 1980. During the next three decades it can be easily seen that nuclear power had taken quite serious amount of units (155) and, other main sources comprised about 27(coal and petroleum) and 2 (natural gas and hydro) respectively.
It is clear from the data given that there are some significant differences in the energy sources.

where was a rise of roughly 100 units at coal.
where there was a rise of roughly 100 units at coal.
Sentence: The presented charts illustrate the changes in the generation of electricity by five main sources, namely coal, peyroleum, natural gas, nuclear and hydro over a period of three decades in Germany and New Zealand.
Error: peyroleum Suggestion: petroleum
Sentence: The source of coal, in 1980, in New Zealand, constituded its overwhelming majority with 56 , while petroleum accounted for 11, whereas natural gas and hydro energy manifested themselves at the same amount of overall units with 30.
Error: constituded Suggestion: constituted
flaws:
Not a good or a wrong conclusion:
'It is clear from the data given that there are some significant differences in the energy sources.'
Attribute Value Ideal
Score: 6.0 out of 9
Category: Satisfactory Excellent
No. of Grammatical Errors: 1 2
No. of Spelling Errors: 2 2
No. of Sentences: 6 10
No. of Words: 184 200
No. of Characters: 894 1000
No. of Different Words: 111 100
Fourth Root of Number of Words: 3.683 4.0
Average Word Length: 4.859 4.6
Word Length SD: 2.609 2.4
No. of Words greater than 5 chars: 63 60
No. of Words greater than 6 chars: 46 50
No. of Words greater than 7 chars: 24 40
No. of Words greater than 8 chars: 21 20
Use of Passive Voice (%): 0 0
Avg. Sentence Length: 30.667 21.0
Sentence Length SD: 6.848 7.5
Use of Discourse Markers (%): 0.333 0.12
Sentence-Text Coherence: 0.514 0.35
Sentence-Para Coherence: 0.842 0.50
Sentence-Sentence Coherence: 0.136 0.07
Number of Paragraphs: 4 4