The table below shows the results of surveys in 2000, 2005 ad 2010 about one university.
Summarize the information by selecting and reporting the main features, and make comparisons where relevant.
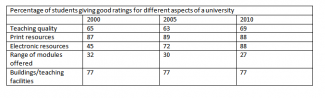
The table gives information about the proportion of students who satisfied with the quality of some particular fields in an university between three different years. Overall, the students’ opinions for these aspects changed insignificantly, except for electronic resources.
During this 10 year period, the most considerable improvement belonged to electronic resources, which rose from 45% in 2000 and nearly doubled in 2010. This term then become one in two aspects in which most university students took good attitudes. Besides, there was also a slight upward trend in ratings for teaching qua...
Subscribe as testbig VIP readers and get unlimited access to essays on the top list.

the proportion of students who satisfied with the quality of some particular fields
the proportion of students who are satisfied with the quality of some particular fields
the proportion of students satisfied with the quality of some particular fields
Not only ranked at the lowest position in 2000 with just a third of students rating well but this figure also fell to 27% in 2010.
Not only was it ranked at the lowest position in 2000 with just a third of students rating well but this figure also fell to 27% in 2010.
Attribute Value Ideal
Score: 6.5 out of 9
Category: Good Excellent
No. of Grammatical Errors: 2 2
No. of Spelling Errors: 0 2
No. of Sentences: 9 10
No. of Words: 175 200
No. of Characters: 902 1000
No. of Different Words: 117 100
Fourth Root of Number of Words: 3.637 4.0
Average Word Length: 5.154 4.6
Word Length SD: 2.799 2.4
No. of Words greater than 5 chars: 70 60
No. of Words greater than 6 chars: 53 50
No. of Words greater than 7 chars: 39 40
No. of Words greater than 8 chars: 25 20
Use of Passive Voice (%): 0 0
Avg. Sentence Length: 19.444 21.0
Sentence Length SD: 5.058 7.5
Use of Discourse Markers (%): 0.444 0.12
Sentence-Text Coherence: 0.392 0.35
Sentence-Para Coherence: 0.589 0.50
Sentence-Sentence Coherence: 0.053 0.07
Number of Paragraphs: 3 4