The two pie charts below show the marital status of Australia’s and Canada’s populations for 1999 and 2000 respectively. Summarise the information by selecting and reporting the main features, and make comparisons where relevant.
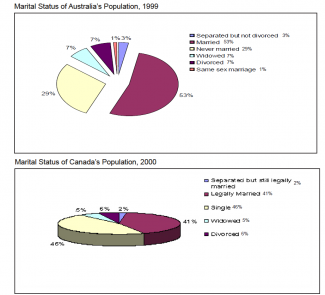
The two pie charts give information about the marital situation in Canada for 1999 and in Australia for 2000. According to the data given by the graphs, it can be clearly seen that there is a diversity of people classified by status in the two countries, on top being Australia with 6 sectors compared to 5 sectors in Canada.
Having an analysis by the level of percentage, Australia has the highest percentage for the married sector(53%) while Canada tends for single(46%). There are not so many people who stay away from their married partners in each country, only 2% of Australians and 3% of Canadians. The widowed people in Australia are as numerous as divorced ones, about 7%, whereas, in Canada, the stability between these two categories has not remained the same. The never married status and legally married is the second highest population in Australia and Canada respectively.
One remarkable thing to point out is the same sex marriage has appeared in Australia in the last year of 20 century and has no any influence in the next year among Canadians.
In summary, it can be easily noticed that marital status varies from a country to the other country.

Comments
Could you check and graduate
Could you check and graduate the essay again, please? I will try to formulate another conclusion.
One remarkable thing to point
One remarkable thing to point out is the same sex marriage has appeared
One remarkable thing to point out is that the same sex marriage has appeared
6.5 out of 9
while Canada tend for single(46%).
while Canada tends for single(46%).
One remarkable thing to point out is the same sex marriage has appeared
One remarkable thing to point out is that the same sex marriage has appeared
The widowed people are as numerous as divorced ones, about 7%
The widowed people in Australia are as numerous as divorced ones, about 7%
is the highest second population in Australia, respectively Canada.
is the second highest population in Australia and Canada respectively.
flaws:
1. No. of Grammatical Errors: 4 2
2. This is not for conclusion:
There is a diversity of people classified by status in the two countries, on top being Australia with 6 sectors compared to 5 sectors in Canada.
Attribute Value Ideal
Score: 5.5 out of 9
Category: Satisfactory Excellent
No. of Grammatical Errors: 4 2
No. of Spelling Errors:0 2
No. of Sentences: 7 10
No. of Words: 179 200
No. of Characters: 842 1000
No. of Different Words: 111 100
Fourth Root of Number of Words: 3.658 4.0
Average Word Length: 4.704 4.6
Word Length SD: 2.608 2.4
No. of Words greater than 5 chars: 62 60
No. of Words greater than 6 chars: 48 50
No. of Words greater than 7 chars: 32 40
No. of Words greater than 8 chars: 22 20
Use of Passive Voice (%): 0 0
Avg. Sentence Length: 25.571 21.0
Sentence Length SD: 5.827 7.5
Use of Discourse Markers (%): 0.571 0.12
Sentence-Text Coherence: 0.459 0.35
Sentence-Para Coherence: 0.67 0.50
Sentence-Sentence Coherence: 0.064 0.07
Number of Paragraphs: 4 4