The two pie charts below show some employment patterns in Great Britain in 1992.
Employees and self-employed: by sex and occupation, 1992
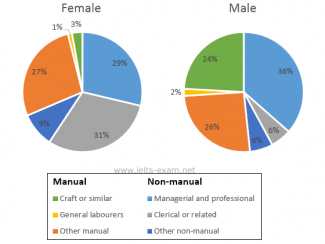
This two pie charts illustrate the proportion of employment, divided by genders, in Great Britain in the period of 1992.
Overall, for both genders, there was had huge differences. For male, non-manual, managerial and professional were the highest percentage while clerical or related was the major proportion for female. Also, there were three least proportion on males which were General Labourers, Clearical or Related, and Other non-manual and in female proportion were Craft or Similar, and General Labourers.
It is evident that Managerial and professional had the highest percentage of 36% as opposed to 29 % for females. In term of Craft or similar, there were a big different with 21%, between the genders pie chart. Similarly, non-manual, clerical or related, for Men and Women had 6% and 31%. Moreover, Other manual for Men and Women were merely 1% different, 26% and 27% respectively. The least manual, general labourers, males had doubled it compared to females.
Two charts give information about men and women were doing different job in Great Britain the given period.

Two charts give information about men and women were doing different job in Great Britain the given period.
Two charts give information about men and women who were doing different jobs in Great Britain in the given period.
Attribute Value Ideal
Score: 7.0 out of 9
Category: Good Excellent
No. of Grammatical Errors: 1 2
No. of Spelling Errors: 0 2
No. of Sentences: 10 10
No. of Words: 173 200
No. of Characters: 871 1000
No. of Different Words: 101 100
Fourth Root of Number of Words: 3.627 4.0
Average Word Length: 5.035 4.6
Word Length SD: 2.722 2.4
No. of Words greater than 5 chars: 62 60
No. of Words greater than 6 chars: 53 50
No. of Words greater than 7 chars: 30 40
No. of Words greater than 8 chars: 26 20
Use of Passive Voice (%): 0 0
Avg. Sentence Length: 17.3 21.0
Sentence Length SD: 5.255 7.5
Use of Discourse Markers (%): 0.4 0.12
Sentence-Text Coherence: 0.42 0.35
Sentence-Para Coherence: 0.634 0.50
Sentence-Sentence Coherence: 0.082 0.07
Number of Paragraphs: 4 4