In the course of an experiment, 95 measurements were recorded, and all of the measurements were integers. The 95 measurements were then grouped into 7 measurement intervals. The graph above shows the frequency distribution of the 95 measurements by measurement interval.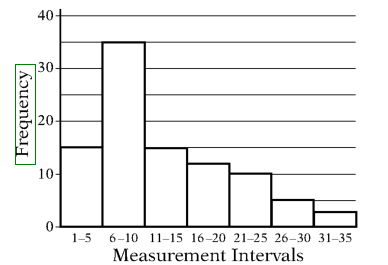
Quantity A
The average (arithmetic mean) of the 95 measurements
Quantity B
The median of the 95 measurements