The chart below shows the amount of money per week spent on fast foods in Britain. The graph shows the trends in consumption of fast foods.
Write a report for a university lecturer describing the information shown below.
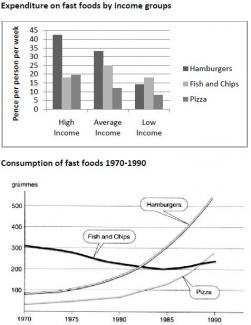
The images below illustrate the fast food consumption in Britain.
The chart illustrates how much money is spent on fast food every week, and the graph describes the consumption of fast food between 1970 and 1990.
A person with high income consumes about 40 hamburgers per week, while for average it is between 30 and 35, and for low income it is only 15. However, the consumption of fish and chips is a little over 15 for a person with higher income, but for an average person it is around 20 and for a poorer one it is between those two. Pizza seems to be consumed the least by all, about 20 by a wealthy, 10 by an average and around 7 by a poor consumer.
The graph shows that the most increased product consumption is seen among the hamburgers over the 20 years, going from 20 grams to over 500. Pizza follows, with increasing from about 30 to around 300 grams, while we can see that fish and chips consumption has descended between 1970-1985 (from 300 to 200 grams), and slightly increased again during the last 5 years hitting its maximum at around 230 grams.

Attribute Value Ideal
Score: 7.0 out of 9
Category: Good Excellent
No. of Grammatical Errors: 0 2
No. of Spelling Errors: 0 2
No. of Sentences: 7 10
No. of Words: 196 200
No. of Characters: 848 1200
No. of Different Words: 106 100
Fourth Root of Number of Words: 3.742 4.0
Average Word Length: 4.327 4.6
Word Length SD: 2.359 2.4
No. of Words greater than 5 chars: 48 60
No. of Words greater than 6 chars: 33 50
No. of Words greater than 7 chars: 19 40
No. of Words greater than 8 chars: 15 20
Use of Passive Voice (%): 0 0
Avg. Sentence Length: 28 21.0
Sentence Length SD: 10.114 7.5
Use of Discourse Markers (%): 0.429 0.12
Sentence-Text Coherence: 0.457 0.35
Sentence-Para Coherence: 0.786 0.50
Sentence-Sentence Coherence: 0.192 0.07
Number of Paragraphs: 4 4