The graph and table below give information about water use worldwide and water consumption in two different countries.
Summarise the information by selecting and reporting the main features, and make comparisons where relevant.
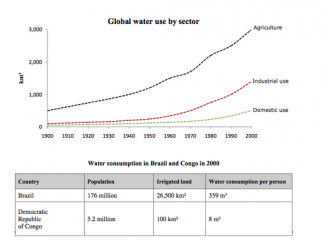
Given are the charts providing clear information about the main purposes of water usage during a decade and the amount of water consumed in various countries, namely, Brazil and Congo.
It is clearly visible that, generally the quantity of water utilized by three major sections has significantly increased. Likewise, it can be also observed that there are notable alterations in consuming habits of indicated countries.
In 1900 the agricultural section was leading with 500 km3 and was noticeably ahead of industrial and domestic sectors which were almost equally. Then, the figure for agricult...
Subscribe as testbig VIP readers and get unlimited access to essays on the top list.

Attribute Value Ideal
Score: 8.0 out of 9
Category: Excellent Excellent
No. of Grammatical Errors: 0 2
No. of Spelling Errors: 0 2
No. of Sentences: 10 10
No. of Words: 213 200
No. of Characters: 1068 1000
No. of Different Words: 130 100
Fourth Root of Number of Words: 3.82 4.0
Average Word Length: 5.014 4.6
Word Length SD: 2.649 2.4
No. of Words greater than 5 chars: 77 60
No. of Words greater than 6 chars: 55 50
No. of Words greater than 7 chars: 39 40
No. of Words greater than 8 chars: 24 20
Use of Passive Voice (%): 0 0
Avg. Sentence Length: 21.3 21.0
Sentence Length SD: 5.041 7.5
Use of Discourse Markers (%): 0.4 0.12
Sentence-Text Coherence: 0.371 0.35
Sentence-Para Coherence: 0.713 0.50
Sentence-Sentence Coherence: 0.047 0.07
Number of Paragraphs: 5 4