The graph below show the consumption of fish and some different kinds of meat in a European country between 1979 and 2004.
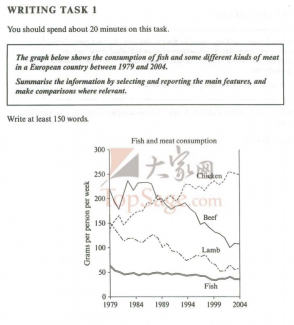
A glance at the chart provided reveals fish and three different kinds of meat consumption in a European country between 1979 and 2004. It is evident that the consumption of beef, lamb and fish saw different extents of decline while these years saw a rapid growth in chicken consumption.
In 1979, the amounts of beef, lamb and fish consumed are were 55 grams, 150 grams and 220 grams per capita per week respectively. Decreasing to approximately 175 grams per person per week in about 1981, the beef consumption showed an exponential growth in a quite short period for almost 2 years, reaching its ...
Subscribe as testbig VIP readers and get unlimited access to essays on the top list.

It is on top list:
http://www.testbig.com/essay-categories/ielts
Attribute Value Ideal
Score: 8.0 out of 9
Category: Excellent Excellent
No. of Grammatical Errors: 0 2
No. of Spelling Errors: 0 2
No. of Sentences: 8 10
No. of Words: 237 200
No. of Characters: 1121 1000
No. of Different Words: 109 100
Fourth Root of Number of Words: 3.924 4.0
Average Word Length: 4.73 4.6
Word Length SD: 2.626 2.4
No. of Words greater than 5 chars: 70 60
No. of Words greater than 6 chars: 49 50
No. of Words greater than 7 chars: 33 40
No. of Words greater than 8 chars: 24 20
Use of Passive Voice (%): 0 0
Avg. Sentence Length: 29.625 21.0
Sentence Length SD: 9.937 7.5
Use of Discourse Markers (%): 0.625 0.12
Sentence-Text Coherence: 0.53 0.35
Sentence-Para Coherence: 0.774 0.50
Sentence-Sentence Coherence: 0.233 0.07
Number of Paragraphs: 4 4