The pie chart below shows the main reasons why agricultural land becomes less productive. The table shows how these causes affected three regions of the world during the 1990s.
Summarise the information by selecting and reporting the main features, and make comparisons where relevant.
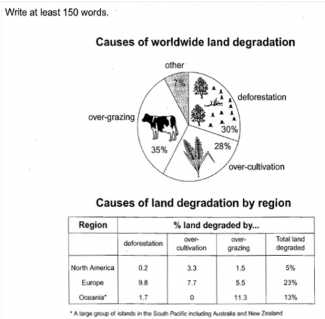
The pie chart and table are display that there are three factors influenced the farmland of three districts becoming less productive.
In terms of the land degradation, the largest proportion of over-grazing which was represented 35%, with the deforestation was account for 30% and 28% for over-cultivation. Other factors make up only 7%.
According to the table illustrates that in different places during the 1990s, Europe was suffered the highest percentage of land degradation (23%), which was due to the deforestation constituted 9.8% and over-cultivation was at 7.7%. By contrast, Oceania had 13% of degraded farmland and the mainly owing to over-grazing (11.3%). North America had a lower proportion of degraded farmland only at 5%, and the main causes of this were over-cultivation (3.3%) and over-grazing (1.5%).
To sum up, it is clear that Europe suffered the more severe land degradation than other regions, and the main factors were because of deforestation and over-cultivation.

there are three factors influenced the farmland of three districts becoming less productive.
there are three factors which influenced the farmland of three districts being less productive.
Sentence: By contrast, Oceania had 13 of degraded farmland and the mainly owing to over-grazing 11.3.
Description: The fragment the mainly owing is rare
the main causes of this were over-cultivation
the main causes of this was over-cultivation
According to the table illustrates that in different places during the 1990s
The table illustrates that in different places during the 1990s
flaws:
No. of Grammatical Errors: 4 2
Read a good grammar book. Maybe this one: http://www.testbig.com/question/grammar
Attribute Value Ideal
Score: 5.0 out of 9
Category: Satisfactory Excellent
No. of Grammatical Errors: 4 2
No. of Spelling Errors: 0 2
No. of Sentences: 7 10
No. of Words: 154 200
No. of Characters: 801 1000
No. of Different Words: 91 100
Fourth Root of Number of Words: 3.523 4.0
Average Word Length: 5.201 4.6
Word Length SD: 3.414 2.4
No. of Words greater than 5 chars: 51 60
No. of Words greater than 6 chars: 44 50
No. of Words greater than 7 chars: 33 40
No. of Words greater than 8 chars: 24 20
Use of Passive Voice (%): 0 0
Avg. Sentence Length: 22 21.0
Sentence Length SD: 8.619 7.5
Use of Discourse Markers (%): 0.143 0.12
Sentence-Text Coherence: 0.47 0.35
Sentence-Para Coherence: 0.748 0.50
Sentence-Sentence Coherence: 0.097 0.07
Number of Paragraphs: 4 4