The table and bar chart show how journey times in a city centre changed after improvements were made to transport in the city.
Summarize the information by selecting and reporting the main features, and make comparisons where relevant.
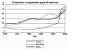
The table shows the group of transport with an average time between before the improvement and after the improvement. Besides, the bar chart present about types of transport with their cost per kilometer.
Average journey time of mass rapid transit (train and bus) after improvement is faster six and five minutes than before. Public transport is cheaper than a taxi and car. Besides, contrast time in private transport it is the same as bus after enriching. On the other hand, taxi is type transport with smallest contrast time after improvement. This transport is the most expensive transport to around the city.
Bus is the cheapest transport with longest time to surrounding the downtown, after improvement, he needs 23 minutes to surrounding the place with average cost 40 cents per kilometer. Tram spent 16 minutes with price about forty cents to surrounding the city after improvement, but he needs twenty-minute to surrounding the town before enriching.
Third place of cost, there is a private car with average cost about one Euro. Car can around the city Center in fifteen minutes after the improvement and 10 minutes before the improvement. Besides, taxi is the most expensive cost but can surrounding downtown quickly. Taxi just spent twelve minutes before the development, and a quarter-hour after enrichment with cost one Euro 80 cents.
Overall, improvement transport network causes disadvantages for private transport and exclusive public transport because average journey time after improvement is longer than before. However, it causes benefits for public transport because average time is faster than before enriching.

the bar chart present about
the bar chart presents about
after improvement is faster six and five minutes than before.
after improvement is six and five minutes faster than before.
time to surrounding the downtown,
time to surround the downtown,
he needs 23 minutes to surrounding the place
it needs 23 minutes to surround the place
Sentence: This transport is the most expensive transport to around the city.
Description: The token to is not usually followed by a preposition
Suggestion: Refer to to and around
Sentence: Besides, taxi is the most expensive cost but can surrounding downtown quickly.
Description: A modal auxillary is not usually followed by a verb, present participle or gerund
Suggestion: Refer to can and surrounding
flaws:
No. of Words: 257 200
Sentence Length SD: 5.302 7.5
No. of Grammatical Errors: 6 2
Read a good grammar book.
Attribute Value Ideal
Score: 5.5 out of 9
Category: Satisfactory Excellent
No. of Grammatical Errors: 6 2
No. of Spelling Errors: 0 2
No. of Sentences: 15 10
No. of Words: 257 200
No. of Characters: 1349 1000
No. of Different Words: 109 100
Fourth Root of Number of Words: 4.004 4.0
Average Word Length: 5.249 4.6
Word Length SD: 2.689 2.4
No. of Words greater than 5 chars: 98 60
No. of Words greater than 6 chars: 79 50
No. of Words greater than 7 chars: 47 40
No. of Words greater than 8 chars: 40 20
Use of Passive Voice (%): 0 0
Avg. Sentence Length: 17.133 21.0
Sentence Length SD: 5.302 7.5
Use of Discourse Markers (%): 0.467 0.12
Sentence-Text Coherence: 0.431 0.35
Sentence-Para Coherence: 0.661 0.50
Sentence-Sentence Coherence: 0.165 0.07
Number of Paragraphs: 5 4