The chart below shows the amount of money per week spent on fast foods in Britain. The graph shows the trends in consumption of fast foods. Write a report for a university lecturer describing the information shown below.
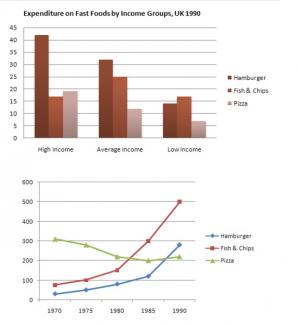
The graph and line graph provided details about expenditure fast foods by income groups and amount of consumption by three kinds of fast food by Britons per week during 2 decade, between 1970 through 1990 in UK.
The first, the graphs indicates that the highest earners was more trend on 'Hamburgers' than the other types of food in this group, expenditure more than twice as high on Hamburgers at 43 pence per person per week than others which are 'Fish and Chips' and 'Pizza' below 20 pence per week. Moreover, in the second group, Average Income also consumed 'Hamburgers' as the most favor, while others were 25 and 13 pence per week on 'Fish and Chips' and 'Pizza' . In the last group, Low Income was spending 18 pence person per week on 'Fish and Chips' as the top of fast food rates, continued by 'Hamburgers' and 'Pizza' were at 14 and 8 pence severally.
The second, in 1970, 'Fish and Chips' as the highest total of consumption was spending 300 point, 'Hamburgers' and 'Pizza' were beneath of 'Fish and Chips' by connoisseur. However, there was an interesting both of 'Hamburgers' and 'Pizza' which were increased significantly and steadily respectively. Whereas, consumption of 'Fish and Chips' was fallen slightly until 1985 and had risen gradually as one of popular fast food.
Overall, 'Hamburgers' and 'Fish and Chips' of fast foods were consumed as the dominant food by Britons in 2 decades from 1970 through 1990.

The first,
First,
The second
Second
Sentence: The graph and line graph provided details about expenditure fast foods by income groups and amount of consumption by three kinds of fast food by Britons per week during 2 decade, between 1970 through 1990 in UK.
Description: A noun, singular, common is not usually followed by an adjective
Suggestion: Refer to expenditure and fast
the highest earners was more trend on 'Hamburgers'
the highest earners were more trended on 'Hamburgers'
flaws:
No. of Grammatical Errors: 4 2
No. of Words: 244 200
Write the essay in 20 minutes.
Attribute Value Ideal
Score: 6.5 out of 9
Category: Good Excellent
No. of Grammatical Errors: 4 2
No. of Spelling Errors: 0 2
No. of Sentences: 8 10
No. of Words: 244 200
No. of Characters: 1125 1000
No. of Different Words: 114 100
Fourth Root of Number of Words: 3.952 4.0
Average Word Length: 4.611 4.6
Word Length SD: 2.402 2.4
No. of Words greater than 5 chars: 61 60
No. of Words greater than 6 chars: 46 50
No. of Words greater than 7 chars: 30 40
No. of Words greater than 8 chars: 21 20
Use of Passive Voice (%): 0 0
Avg. Sentence Length: 30.5 21.0
Sentence Length SD: 10.356 7.5
Use of Discourse Markers (%): 0.625 0.12
Sentence-Text Coherence: 0.54 0.35
Sentence-Para Coherence: 0.776 0.50
Sentence-Sentence Coherence: 0.231 0.07
Number of Paragraphs: 4 4