The chart below shows the changes in average house pries in five different cities between 1990 to 2002 compared with the average house prices in 1989.
Summarize information by selecting and reporting the main features,and make comparisons where relevant.
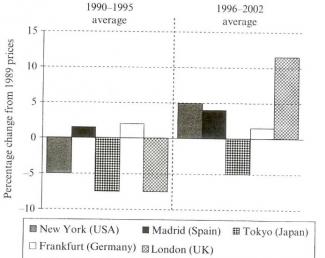
The graph compares the changes occurred in average price levels of houses in in five different cities from the period 1990-2002 with the prices in base year which is 1989. It can be clearly seen from the graph that during 1990-1995, the percentage change in average price levels in Tokyo and London were immense and they were declined when compared with base year percentage while London faced an upward trend in percentage average price levels with respect to base year
When we analyse the graph thoroughly, we come to know that New York, Tokyo and London are the only cities faced a slump in percentage average prices during 1990-1995, declined from base price to -5% in New York and -7% in both London and Tokyo. In contrary, the percentage price levels increased considerably especially in London and a bit less in New York from 1996-2002 with respect to base year price, went up from 0 to 5% in New York and 0 to 12% in London raising concern. In opposition, prices in Tokyo remained below base year price,slightly improved to -5% but a bit better than what was during 1990-95.
Moreover, Identical figures were seen in the average price percentage when they went up to 2% in Madrid during 1990-1995 and the same in Frankfurt from 1996-2002 with respect to base year ice while the average price percentage in Frankfurt was only 1% higher from what it was Madrid during 1990-1995. Furthermore, Madrid faced a further acceleration in percentage average price during 1996-2002 when it increased to 4% when compared with price of base year.
All in all, average prices in New York and London varied over the years in comparison with base year price but, In contrast they remained on the same scale for Tokyo, Madrid and Frankfurt.

Sentence: The graph compares the changes occurred in average price levels of houses in in five different cities from the period 1990-2002 with the prices in base year which is 1989.
Description: The tag a preposition is not usually followed by in
Suggestion: Refer to in and in
flaws:
No. of Words: 300 200
Attribute Value Ideal
Score: 7.0 out of 9
Category: Good Excellent
No. of Grammatical Errors: 1 2
No. of Spelling Errors: 0 2
No. of Sentences: 7 10
No. of Words: 300 200
No. of Characters: 1400 1000
No. of Different Words: 116 100
Fourth Root of Number of Words: 4.162 4.0
Average Word Length: 4.667 4.6
Word Length SD: 2.425 2.4
No. of Words greater than 5 chars: 97 60
No. of Words greater than 6 chars: 63 50
No. of Words greater than 7 chars: 43 40
No. of Words greater than 8 chars: 30 20
Use of Passive Voice (%): 0 0
Avg. Sentence Length: 42.857 21.0
Sentence Length SD: 15.706 7.5
Use of Discourse Markers (%): 0.714 0.12
Sentence-Text Coherence: 0.579 0.35
Sentence-Para Coherence: 0.807 0.50
Sentence-Sentence Coherence: 0.294 0.07
Number of Paragraphs: 4 4